Trading
How to Use a Relative Rotation Graph to Analyze Market Trends
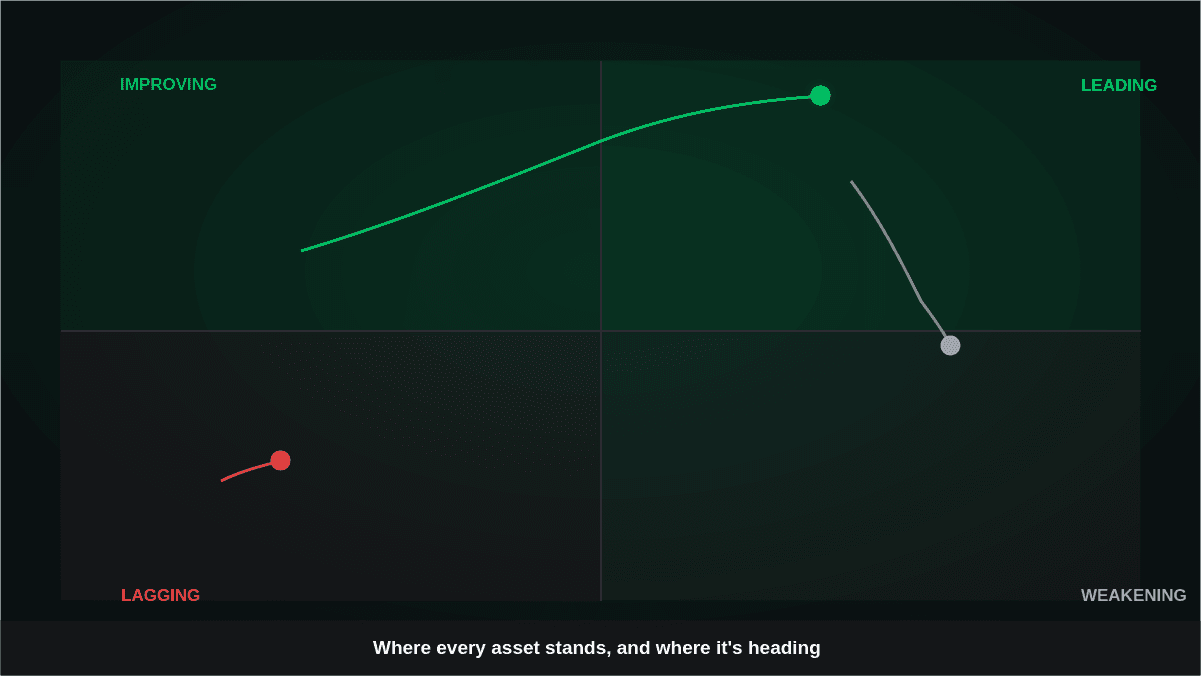
Comparing several stocks, sectors, or ETFs can become difficult when each asset has its own chart. A Relative Rotation Graph (RRG) provides a simpler way to view these relationships by putting multiple assets on one visual chart. If you are learning how to use a relative rotation graph, the most important thing is not simply memorizing what each quadrant means. You also need to understand how an asset moves, what it is being compared against, and whether that movement is supported by other market evidence.
September 4, 2026
Read more