Backtesting gives traders a way to examine how a trading idea might have performed under historical market conditions before risking capital. FX replay backtesting platform overview discusses the way in which the FX Replay implements the process, starting from replaying the price action and ending with performance analysis. It is important to realize that past achievements do not guarantee future success but can help to analyze and improve testing skills.
A major benefit of structured testing is that it replaces vague assumptions with measurable observations. Traders can define rules, replay markets, record trades, and examine the resulting backtesting metrics. However, the quality of any conclusion still depends on the strategy, data, testing method, and assumptions used.
In this blog you will explore a proper FX Replay Backtesting Platform Overview including the features, uses and its limitations.
What Is FX Replay Designed to Do?
FX Replay provides users with the opportunity to replay the markets and test trades against past data. The main idea behind this application is to use historical data on the market to simulate decision making in real time. It is meant to be more than just viewing old charts.
The platform supports markets including:
- Forex
- Crypto
- Futures
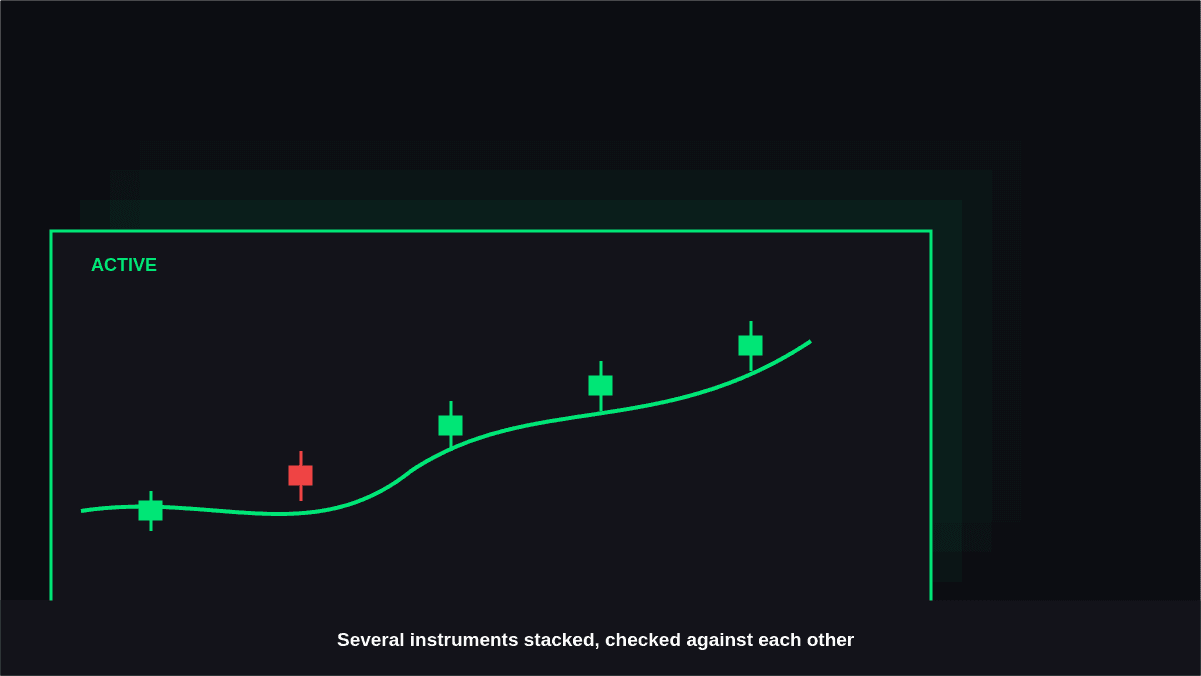
Traders can also use several charts at once and trade several assets, studying the performance of the system under various asset conditions.
Testing across different instruments, market conditions, and historical periods helps traders see whether a strategy remains consistent beyond a single currency pair or market phase.
How Historical Replay Supports Strategy Testing
Traditional chart review can make historical trading decisions seem easier because the outcome is already visible. A replay environment removes some of this hindsight by letting traders move through price action step by step, making technical analysis on common indicator mistakes easier to evaluate in a controlled setting.
This creates a more structured way to evaluate backtesting strategies using only the information available at each point in the replay.
| Feature | How It Helps Traders |
|---|---|
| Step-by-step replay | Evaluates decisions as price action unfolds. |
| Entry, stop-loss, and target | Allows trades to be planned using available information. |
| Adjustable replay speed | Speeds through quiet periods and slows down around setups. |
| Session jumping | Helps reach specific historical periods faster. |
| Lower-timeframe testing | Supports detailed testing of intraday strategies. |
Multi-Chart Testing and Market Context
Trading decisions rarely depend on one chart alone. A setup on EUR/USD, for example, may be influenced by broader market conditions, another correlated instrument, or a higher timeframe.
Multi-chart analysis will enable you to analyze various charts at the same time. The use of various markets may tell you whether the performance of the strategy relies solely on one market.
This is particularly useful when evaluating rules that incorporate:
- Higher and Lower-Time Frame Structure
- Correlated Currency Pairs
- Various Trading Sessions
- Different Asset Classes
- Market Reactions to Scheduled Events
The objective should not be to collect as many charts as possible. Additional information is useful only when it has a defined role in the trading rules being tested.
Which Performance Metrics Matter Most?
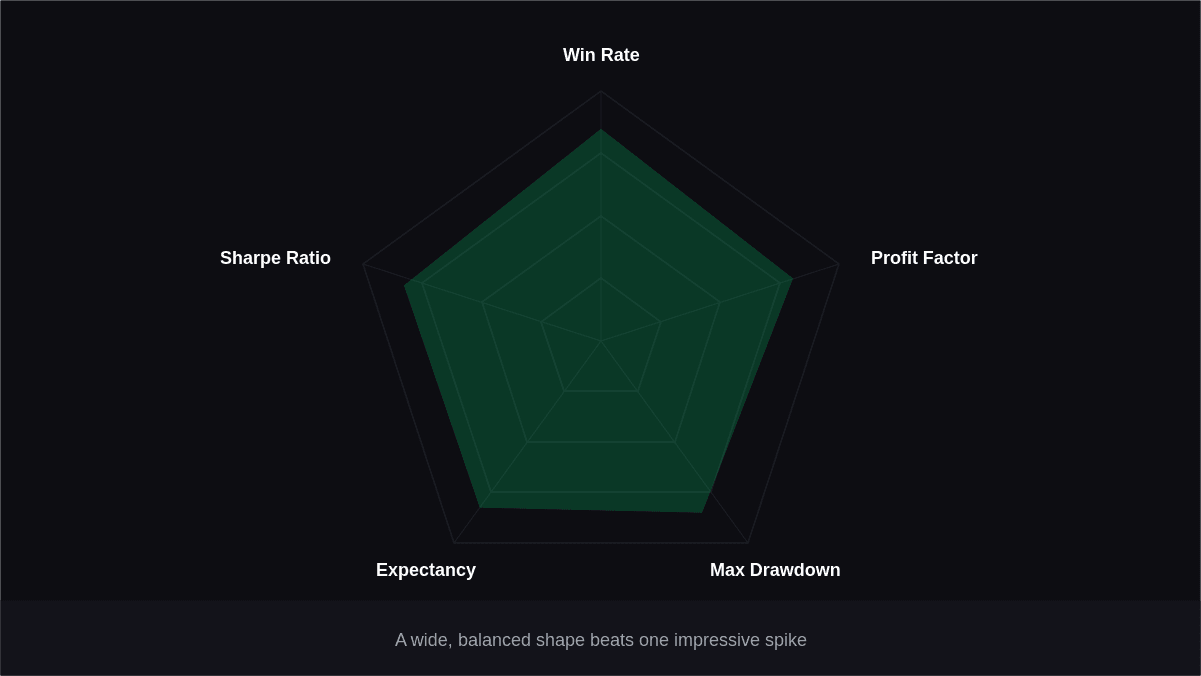
A backtest should do more than just tally up successful trades. Even a system that generates many winning trades can be unprofitable if its losing trades are much bigger than its winning ones.
Useful measurements include:
| Metric | What It Helps Identify | Why It Matters |
|---|---|---|
| Win rate | Percentage of profitable trades | Shows how frequently trades succeed |
| Profit factor | Gross profits relative to gross losses | Provides context for overall trade efficiency |
| Maximum drawdown | Largest decline from an equity peak | Helps assess potential downside |
| Expectancy | Average expected result per trade | Indicates whether the rules have a positive historical edge |
| Sharpe ratio | Return relative to variability | Helps compare risk-adjusted performance |
| Time-based results | Performance by session, day, or period | Reveals when a strategy may work better or worse |
| Trade distribution | Concentration of gains and losses | Shows whether results depend on a few unusual trades |
Looking at several measurements together is more informative than selecting one attractive statistic. For example, a high profit factor may look encouraging, but a strategy that achieves it through a small number of unusually large winners could have a very different risk profile from one with consistent results.
Risk Management Should Be Part of the Backtest
Position sizing should be included during testing so results reflect realistic trading conditions. Key areas to evaluate include:
- Position sizing: Adjust exposure based on stop distance and risk.
- Trade management: Test breakeven rules, stop adjustments, and exit conditions.
- Economic events: Include periods around major announcements when volatility and spreads may change.
- Market conditions: Test across both calm and highly volatile periods.
This makes trading strategy validation more reliable and representative of real-world performance.
Avoiding the Trap of Overfitting
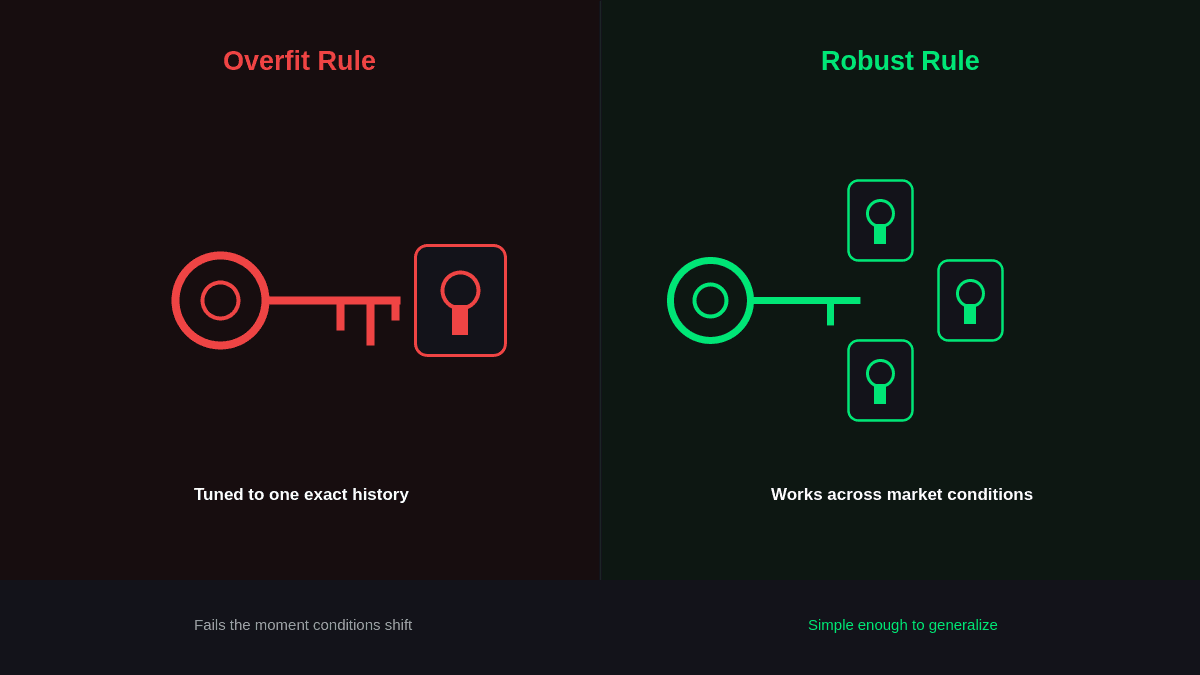
One of the key risks in testing historical data is the risk of overfitting. It means that the system becomes too specific to historical data and thus becomes ineffective when the circumstances change.
For instance, adjusting entry criteria every time you lose a trade may increase performance of the system historically but not make it work in the future. In other words, your backtest will just become a history of optimizations, and not the test.
Instead, it is better to define rules prior to backtesting, leave some room for validation and refrain from constant tuning based on historical data.
Walk-forward testing and out-of-sample testing can be used to understand whether the advantage works outside the period of development of the strategy.
What FX Replay Cannot Tell You
Even a detailed replay cannot reproduce every condition of live trading. Historical testing may not fully capture execution delays, changing liquidity, slippage, spreads, commissions, or the psychological pressure associated with real money.
There is also a difference between following rules in a replay environment and executing them consistently in live markets. This is why traders should validate trading strategies under realistic conditions before relying on historical results.
Consequently, a profitable backtest should be viewed as evidence worth investigating, not as a guarantee of future performance. Paper trading or trading with appropriately small risk can provide another layer of validation before increasing exposure.
A Practical Workflow for Using Replay Testing
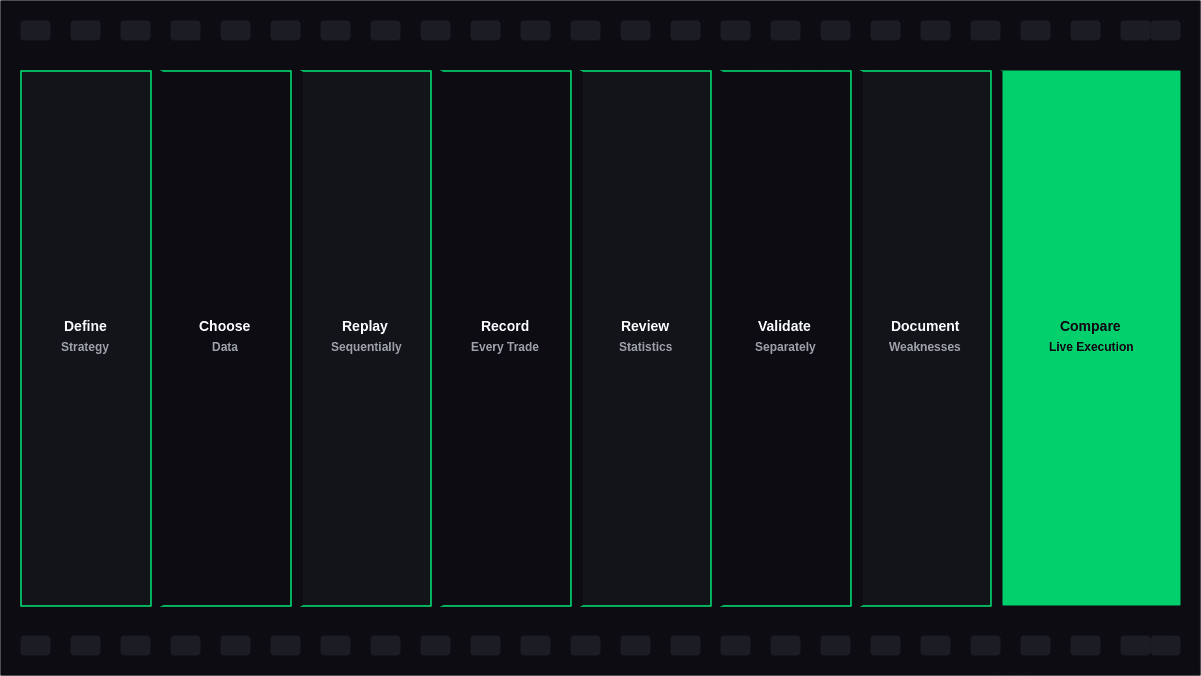
A disciplined process can make historical testing more useful:
- Define the strategy: Write precise entry, exit, risk, and trade-management rules.
- Choose representative data: Include different market conditions rather than selecting only favorable periods.
- Replay sequentially: Make decisions using information available at each historical point.
- Record every trade: Avoid excluding losses or inconvenient setups.
- Review the statistics: Examine drawdown, expectancy, profit factor, and trade distribution.
- Validate separately: Test the rules on data that was not used for development.
- Document weaknesses: Identify market conditions where the strategy consistently struggles.
- Compare with live or simulated execution: Determine whether the historical edge remains practical outside the backtest.
This process helps separate a genuinely repeatable trading concept from a result that depends heavily on historical coincidence.
Final Takeaway
This fx replay backtesting platform overview shows why replay-based testing can be useful for examining trading ideas before applying them to live markets. Historical replay, multi-chart analysis, performance statistics, and risk-management tools can make the testing process more structured.
The more important issue, however, is how the trader uses those tools. Sound testing requires predefined rules, realistic risk assumptions, varied market conditions, and careful in-sample vs out-of-sample testing. A strong historical result is only one part of the evaluation process; it should support further investigation rather than become a reason to assume that future performance is guaranteed.