Markets do not always move in one direction. Prices can move sharply away from their typical level and later return toward it. Reversion Trading is based on this idea, with traders looking for situations where an asset has moved unusually far from its recent average or fair-value reference.
Traders may also consider support resistance levels when assessing whether a price move has become unusually extended.
Instead of assuming that an extended move will continue, this approach looks for evidence that the price may return toward its historical or calculated mean.
Understanding that assumption, how traders identify deviations, and where the approach can fail is essential before using it in a live market.
Understanding Reversion Trading
Reversion trading focuses on the idea that prices may return toward a typical or average level after moving unusually far in one direction. Traders look for signs that the move is losing momentum rather than assuming it will continue.
Key points include:
- Mean reversion: Price may move back toward its average.
- Price action: Recent price behavior helps identify potential setups.
- Market extremes: Traders watch for unusually extended moves.
- Confirmation: Entry decisions often rely on additional signals or indicators.
How Mean Reversion Works in Financial Markets
Mean reversion is built around the observation that some prices or market variables fluctuate around a central value over a particular period.
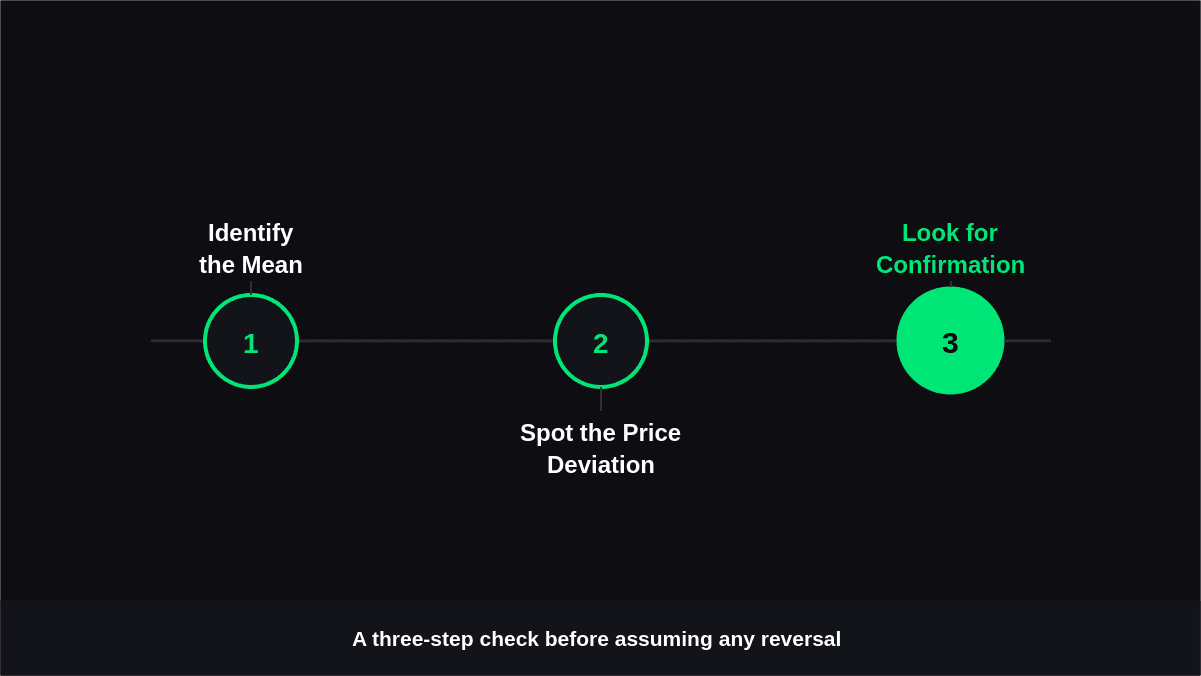
Mean reversion can be broken down into three practical steps:
1. Identify the Mean
Determine the asset’s typical price or average over a specific period. This provides a reference point for measuring deviations.
2. Spot the Price Deviation
Look for a significant move away from that average or its usual trading range. A large deviation may indicate that price has become unusually extended.
3. Look for Reversion Confirmation
Check whether market conditions support a potential move back toward the mean. Confirmation can help avoid assuming that every sharp move will reverse.
Indicators Traders Use to Identify Price Extremes
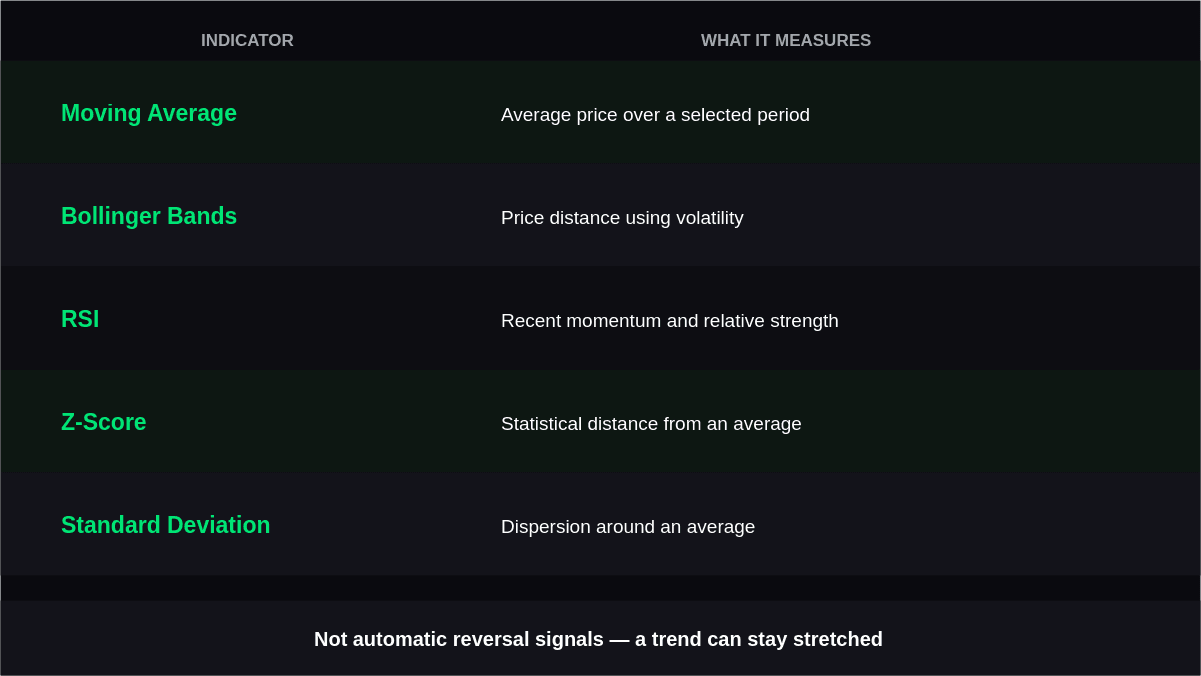
Technical tools can help traders determine how far price has moved from its recent behavior. Common Mean Reversion Indicators include:
| Indicator | What It Measures | How It Can Support Analysis |
|---|---|---|
| Moving Average | Average price over a selected period | Provides a reference mean |
| Bollinger Bands | Price distance from a moving average using volatility | Highlights unusually extended moves |
| RSI | Recent momentum and relative strength | Helps identify potentially stretched conditions |
| Z-Score | Statistical distance from an average | Measures how unusual a deviation is |
| Standard Deviation | Dispersion around an average | Helps assess whether a move is statistically large |
These indicators should not be treated as automatic reversal signals. An asset can remain overbought or oversold while a strong trend continues.
When Does Mean Reversion Make More Sense?
Mean reversion tends to be easier to analyze when a market is moving within a relatively stable range rather than experiencing a powerful directional trend.
For example, a stock that repeatedly moves between established support and resistance levels may provide more opportunities to study deviations from its typical price. In contrast, a stock experiencing a major earnings surprise, regulatory change, or fundamental shift may establish a new price range instead of returning to its previous average.
This is why market context matters. The same technical indicators reading can have very different implications under different conditions.
Reversion Trading vs Trend Following
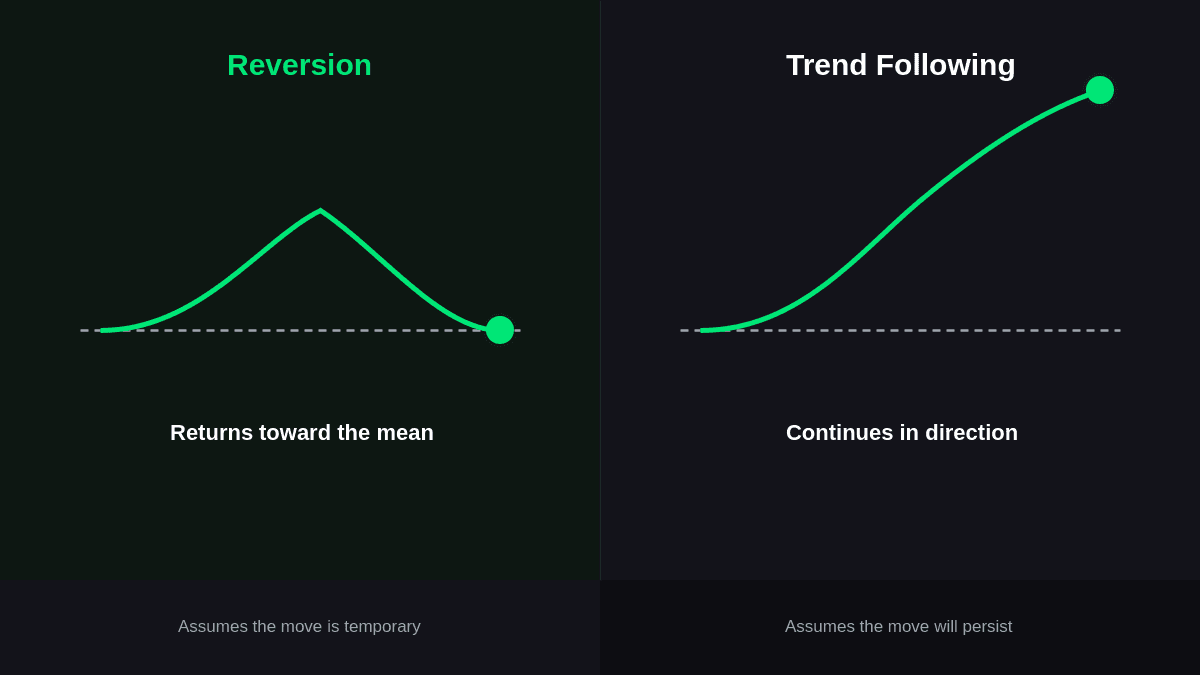
The biggest difference between these approaches is their assumption about what happens after an unusual price movement.
| Factor | Reversion Trading | Trend Following |
|---|---|---|
| Core assumption | Price may move back toward a reference level | Price may continue in the current direction |
| Typical entry | After a significant deviation | After evidence of directional momentum |
| Common environment | Ranges and stable markets | Sustained directional markets |
| Main challenge | Price may continue moving away from the mean | Reversals can create false signals |
| Exit concept | Return toward a mean or predefined target | Trend continuation or trailing exit |
Neither framework works equally well in every market condition. Traders need to understand what type of behavior their strategy is designed to capture.
Why Mean Reversion Signals Can Fail
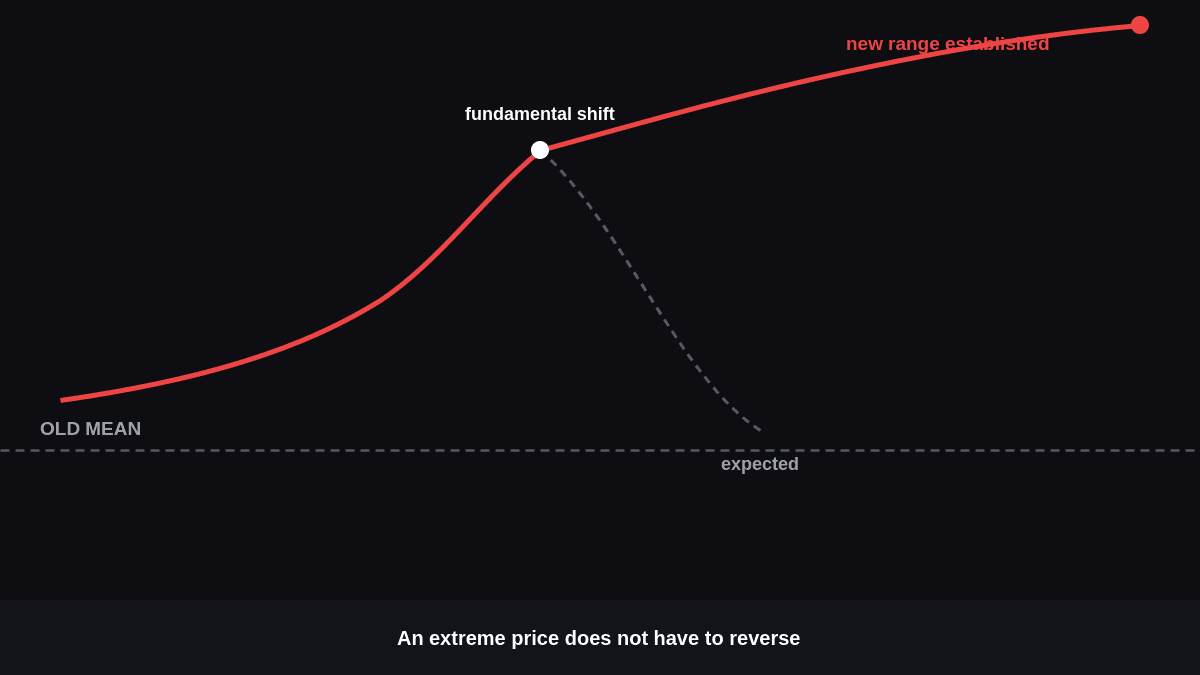
A price moving far from its average does not automatically make it undervalued or ready to reverse.
A company can experience a fundamental event that permanently changes its valuation. Similarly, a currency pair can enter a strong trend after a major economic announcement.
In these situations, using an old average as the expected destination can produce misleading signals.
Other risks include transaction costs, slippage, poor timing, and choosing an inappropriate lookback period. A strategy that works during quiet range-bound conditions can also struggle when volatility expands.
Risk management therefore needs to be considered separately from the signal itself. A trader can be correct about eventual reversion and still experience a substantial loss if the position moves significantly against them first.
How to Evaluate a Reversion Setup
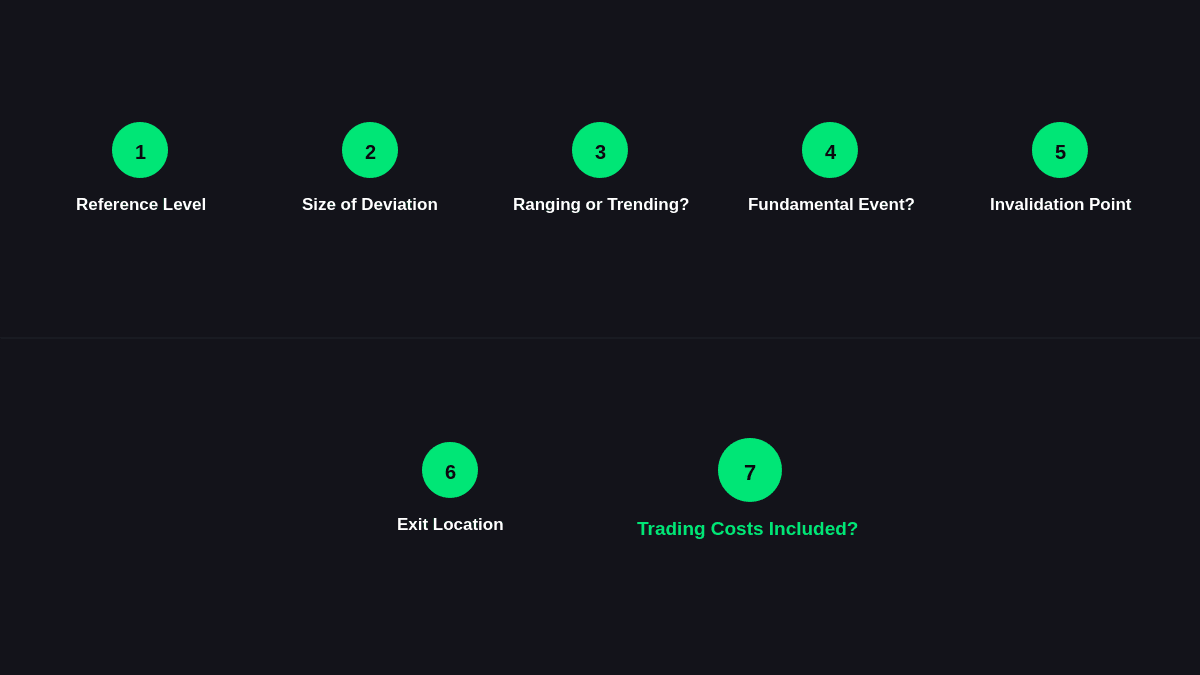
Before entering a trade, traders can examine several questions:
- What reference level defines the mean?
- How unusual is the current deviation?
- Is the market ranging or trending?
- Has a fundamental event changed the underlying conditions?
- What would invalidate the setup?
- Where will the position be exited?
- Have trading costs been included when testing the idea?
Testing these conditions across historical data can help determine whether a perceived pattern is persistent or simply the result of a few favorable trades.
Conclusion
Reversion Trading provides a framework for studying situations where prices move away from a typical level and potentially return toward it.
The approach depends on defining an appropriate mean, measuring the size of the deviation, and recognizing whether the surrounding market conditions support the underlying assumption.
Its usefulness comes from understanding why a price is extended rather than treating every extreme reading as a reversal opportunity. Combining statistical analysis, market context, disciplined exits, and realistic testing can help traders validate trading strategies and evaluate whether a mean reversion idea has a measurable edge rather than relying on the expectation that every unusual move must eventually return.