Volume indicator problems can complicate trading setups. Common problems include unreliable volume data, unusual volume spikes, low-volume periods, differences between markets, timeframe variations, and volume indicator false signals. These problems happen because volume measures trading activity rather than market direction, and the meaning of a volume reading can change depending on the market, timeframe, and price action.
The rise in volume can seem like a good confirmation sign while low volume might mean something bearish, but none of these indicators reveal the whole picture. It should be noted that volume data can also differ depending on different factors. Traders should not rely on volume as an independent signal for going long or short, but rather know when the readings can be misleading.
In this guide, we will learn to detect volume indicator problems, understand the reason behind false signals from volume indicators, troubleshoot any abnormal activities, and make better use of volume analysis in our trading decision-making process.
Why Volume Indicators Can Become Unreliable
Volume indicators can transform the level of trading into data that can be compared against price action. The issue lies in the fact that the raw data may not necessarily reflect market participation in all assets.
Three factors are particularly important:
| Issue | Why it creates confusion | Practical response |
|---|---|---|
| Different volume data | There are different ways volume might be reported by markets | Ensure to know whether the information being provided refers to the transaction or not |
| Unusual activity | The release of news, openings, and other events can lead to unusual readings | See how the movement compares with normal movements for the period |
| Indicator calculation | Each of these tools uses volume in different ways | Find out what each particular volume tool is measuring |
| Timeframe differences | A good read from one timeframe could be absent on another | See if the signal matches the trading timeframe |
| Price-volume disagreement | The volume could increase, but the price does not react accordingly | Wait for confirmation from the price action regarding the setup |
It is not about finding a reading that is right all the time. It is about identifying when the reading is worth considering less.
Volume Data May Not Mean the Same Thing in Every Market
One of the biggest causes of confusion comes when traders assume that all volumes are created equally.
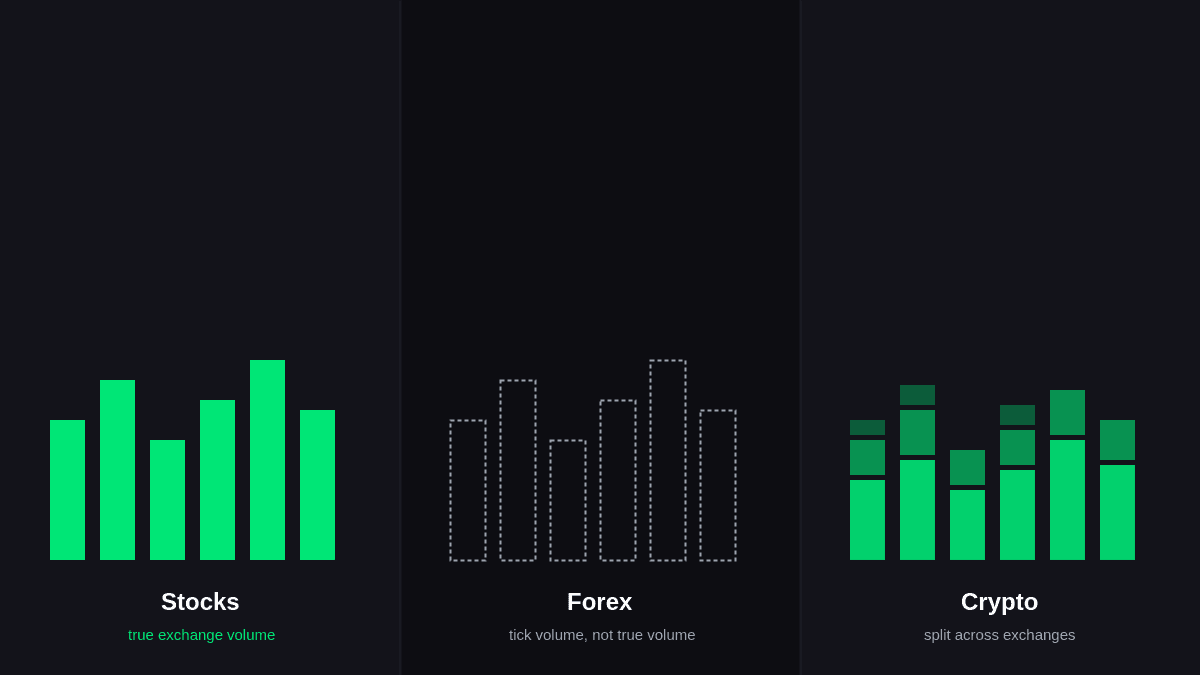
The reporting process can vary greatly depending on the type of market:
- Stocks: Volumes are normally calculated based on the transactions that have already taken place through the specific market infrastructure.
- Forex: Spot forex does not have any stock exchange center; thus, most platforms use tick volume, which measures price changes rather than volume itself.
- Crypto: The trades happen across various exchanges; thus, an increase in trading volume on one of the exchanges does not necessarily mean that the entire market is trading at high volume.
It does not mean that the volume statistics are irrelevant. It just means that traders need to know what kind of volume they are looking at before they compare it with any other asset or market.
Volume Spikes Can Be Misread Without Price Confirmation
While a tall bar on a volume histogram is easily noticeable, the significance of such a bar largely depends on what the price does concurrently.
When looking at a volume spike, keep in mind:
- Where price closes: A strong close near the high or low can provide more directional information than a candle that finishes near its midpoint.
- Whether a key level breaks: High volume during a move beyond established support or resistance can provide stronger confirmation.
- Whether price follows through: Continued movement after the initial surge is more informative than a single high-volume candle.
- The surrounding market structure: A volume spike inside a sideways range may have a different meaning from one occurring during a clear trend.
High volume confirms participation, not direction. Combining it with price action helps reduce volume indicator false signals
Low-Volume Periods Can Distort Signal Quality
Not every volume increase is meaningful. Consider these factors:
- Market sessions: Start and end times are often more active than those during regular market hours.
- Holidays: Activity is often unusually light.
- Shortened sessions: Lighter volume can skew comparisons against normal levels.
- Important news: Major events can cause volume spikes for a time.
- Periods of calm: A slight volume increase could appear significant against recent history alone.
For intraday trading, compare current activity with a historical baseline that reflects the same time of day, rather than relying on one average for the entire session.
Different Volume Indicators Can Give Different Answers
Volume-based tools do not all measure the same relationship. Below you can find the difference to better understand:
| Tool | What it emphasizes | Problem to watch for | Better use |
|---|---|---|---|
| OBV | Cumulative price-volume direction | Long-running totals can become difficult to interpret after major moves | Compare its direction with price structure |
| VWAP | Volume-weighted average price | Session boundaries matter | Use mainly within the timeframe it was designed for |
| MFI | Price and volume momentum | Extreme readings can persist during strong trends | Confirm with broader trend conditions |
| A/D | Relationship between closing position and volume | Large gaps can influence interpretation | Examine alongside the day's price range |
The important lesson is that an indicator's limitation often comes from how it calculates information, not simply from the presence of volume data.
How to Troubleshoot a Suspicious Volume Reading
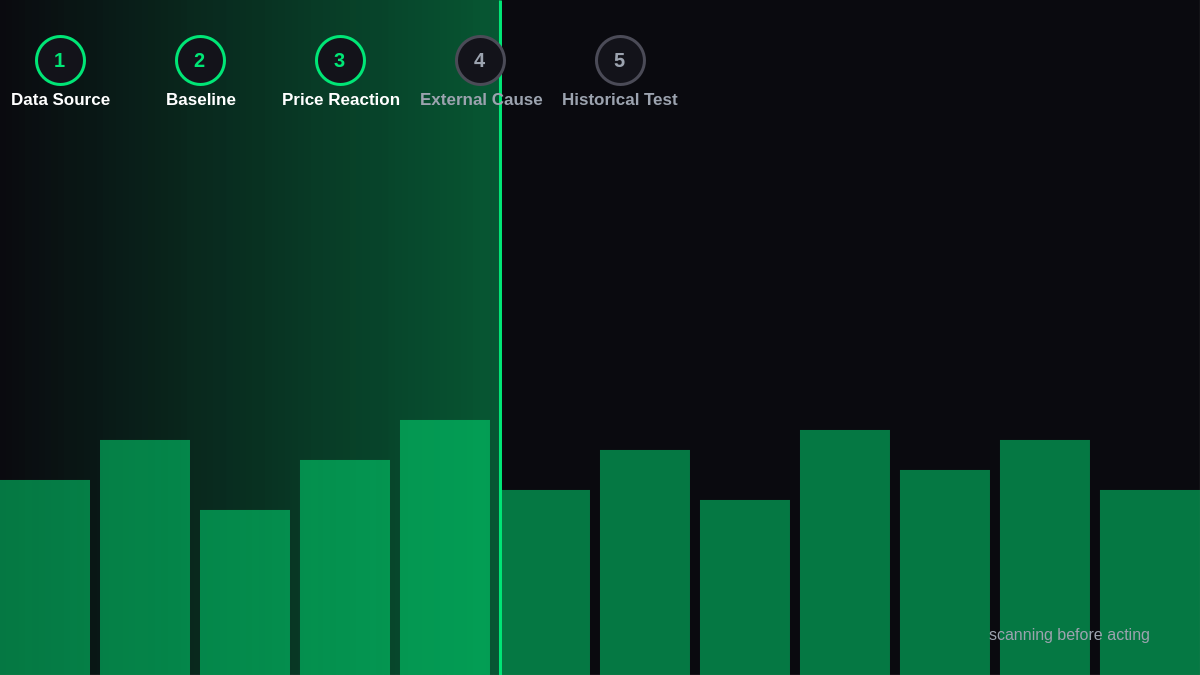
When a volume signal looks unusual, use a simple diagnostic process before changing your strategy.
1. Check the underlying data
First, identify the kind of figure being presented by the platform. Ask yourself whether the figure is exchange volume, total volume or tick volume.
2. Compare it with a relevant baseline
Avoid judging the figure by itself. See how it measures up to normal activity for the same asset class and timeframe.
3. Examine the corresponding price movement
See how the candle or price pattern around the figure looks like. Did price move through the level, reject it, close out of the level, or stayed range-bound?
4. Look for an external explanation
Unusual trading activity will occur due to earning reports, economic data, company news, open market events, and other such triggers.
5. Test the signal across historical examples
If the volume pattern is repeated both prior to good and bad results, then the pattern does not seem to have sufficient standalone value for trading.
This makes volume assessment into a systematic procedure rather than a subjective one.
Avoid Using Volume as a Standalone Entry Trigger
One of the biggest mistakes traders make is establishing the principle “if volume grows, then buy.”
This principle overlooks the distinction between participation and direction. Both buyers and sellers participate when trading occurs; therefore, volume alone cannot tell us who is going to dominate price.
Give Volume a Supporting Role
Instead of this, a better way would be to distribute different tasks among various forms of evidence. The structure of prices could define the set-up, volume could prove that the participation is supportive of it, and risk management could decide whether this trade is viable.
Confirm Volume With Price Action
For instance, the trader could establish a breakout from a clearly defined range. The growth in activity could be the additional proof of it. However, if price quickly reverts back into the range, the breakout failure becomes more important than the growth in volume.
Use Relative Volume Instead of Raw Numbers
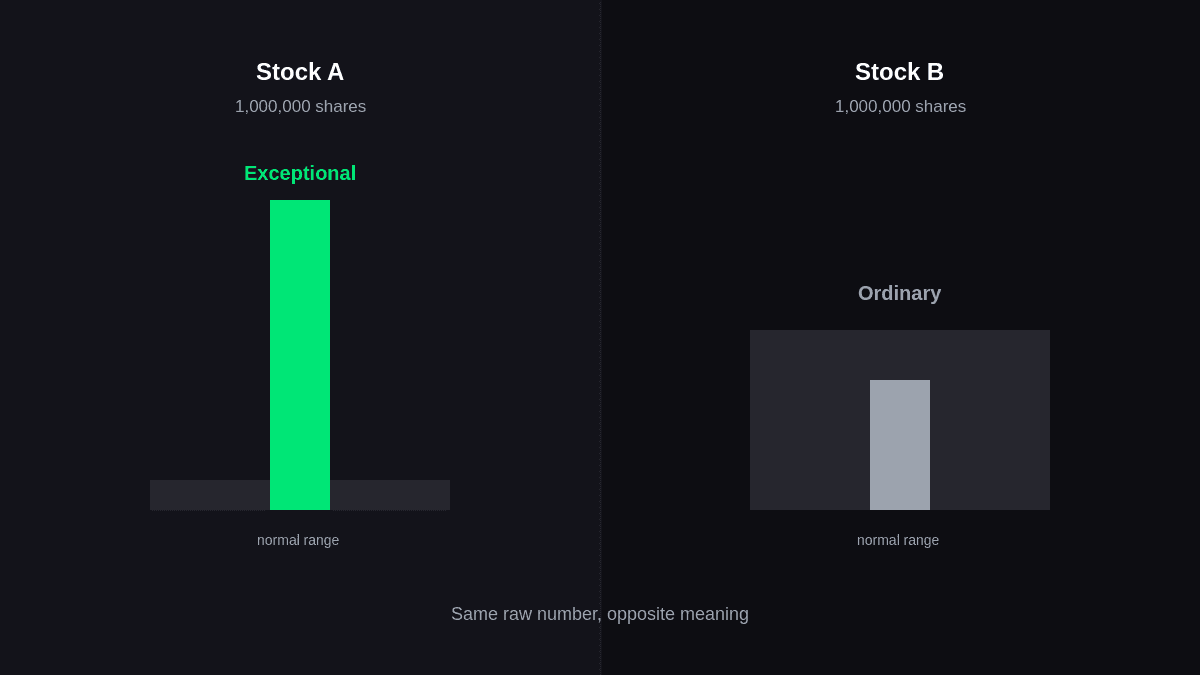
Volume numbers cannot be compared easily across different assets.
One million of volume on some stocks can be very large for a certain stock while it may be normal for another stock. In addition, an intraday volume number should not be directly compared to the total volume of the whole trading session.
The relative measure of volume makes sense when we want to know if the current number is exceptionally high or low when compared to some historical benchmark.
This way, volume analysis can be made more meaningful since the trader assesses the volume in relation to normality rather than giving meaning to a number.
When Volume and Price Disagree
A disagreement between price and volume deserves investigation rather than an immediate trade.
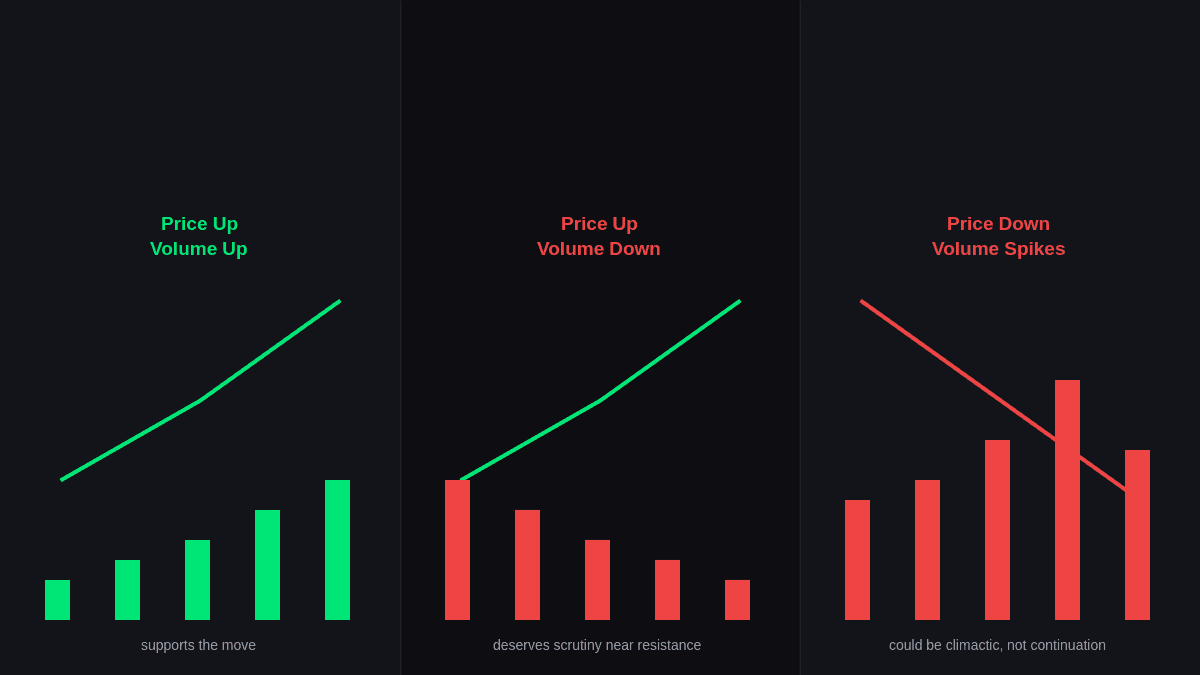
Consider three situations:
- Price rises while activity expands: participation supports the move, but continuation still needs to be established.
- Price rises while activity contracts: the move may deserve closer scrutiny, particularly near resistance.
- Price falls sharply on exceptional activity: this could represent aggressive selling, forced liquidation, or a climactic move rather than a simple continuation signal.
None of these combinations guarantees what happens next. Their value comes from identifying situations that deserve additional analysis.
A Practical Framework for Better Volume Analysis
A useful volume workflow can be kept relatively simple:
Market context → price structure → relative activity → confirmation → risk decision
First of all, determine the overall state of the market. Find the corresponding levels of support, resistance, trends, or range. Compare present behavior against some kind of historical precedent. Is the price confirming the analysis? Only after that, one may ask whether the trade presents an acceptable risk-reward ratio.
In this way, volume will not become the whole system but will help provide important information.
Final Thoughts
Volume indicator problems are typically not issues with the indicator itself, but rather how volume should be analyzed in the absence of proper context. Factors such as different data sources, odd trading hours, the method of calculation and conflicting prices can all serve to lend false validity to a reading.
The simple fix is to use the volume as corroborating evidence, verifying the source of your data, comparing the volume to an appropriate benchmark, analyzing the price movement and testing the condition under repeated occurrences before including it in your strategy.
If done in this way, volume can be quite an asset to the trading decision making process.
FAQs
1. What is the biggest problem with volume indicators?
The most important concern is that volume reflects activity and not intention. If the reading is high, then you can be sure that significant trading has taken place, but this does not necessarily mean that the buyers or sellers will make the next move.
2. Why does volume sometimes give false signals?
Inaccurate volume readings are generated when there is very high or low volume, when prices do not follow through and even when the data on which volume is based does not cover the whole market.
3. Is high volume always bullish?
No. High volumes may occur during trading activities, trend reversals, breaks, or periods of high disagreement between traders. Direction and quality of price movements give us more information.
4. Why is volume different on forex platforms?
Spot FX has no exchange where all trades in the world are made. Because of that, a lot of retail brokers use tick volumes, counting price ticks instead of volume of trade currency.
5. Should traders use more than one volume indicator?
Multiple indicators are not necessarily superior. The different measures can assess similar things in dissimilar ways, leading to confusion. It is better to master one suitable volume measure and integrate it with price structure, market knowledge, and risk management.