A trade idea can seem profitable on a chart but fail in actual trading with money on the line. To assess a trading strategy, it is important to go beyond several winning trades and a profitable equity curve.A proper assessment procedure includes checking whether the trading method works well under various market circumstances, manages risk, and remains reasonable in the course of testing on fresh data.
Validation is basically a control procedure for a trading strategy. It is a way to distinguish a reproducible edge from a success generated by market conditions, excessive optimization, or luck.
This article describes the methodology of the assessment of a trading system, which tests are important, and red flags that signal that a trading system is not yet ready for trading.
What Does Trading Strategy Validation Mean?
Trading strategy validation in the context of trading is the process of evaluating an established trading strategy by examining its historical and projected performance.
It is important not only to identify which strategy will give us the highest return, but also to assess whether it can show consistent performance under reasonable circumstances and without making unreasonable assumptions.
A full validation process could include:
- Historical profitability
- Drawdown and downside risk
- Trade frequency
- Win rate and average trade
- Profit factor
- Performance across market conditions
- Sensitivity to parameter changes
- Out-of-sample results
- Execution assumptions
- Forward-testing performance
This is important because a good strategy can generate excellent returns in the past without being of much use.
Why Historical Profitability Is Not Enough
A strategy that generates a profit on paper does not necessarily mean that the same strategy will generate profits in the future.
Historical data may be deceptive if the strategy is tweaked multiple times using the same data set. Each tweak that happens once the historical data has been reviewed represents an additional chance to optimize on noise.
Consider, for instance, that in case of a moving-average system, the optimal average period turns out to be 17. It would not be wise to change the average period to 17 just because this generated the best historical returns.
If the periods near to 17, such as 15, 16, 18, and 19 are also reasonably good, then confidence in the underlying idea is higher.
A sound validation process should therefore focus on robustness rather than perfection.
A Step-by-Step Process to Validate Trading Strategies
A systematic approach facilitates identification of any weaknesses prior to deployment of funds.
1. Define the Trading Rules Clearly
Begin with rules that can be easily interpreted by someone else.
Identify:
- Entry rules
- Exit rules
- Stop loss rules
- Profit taking rules
- Position size
- Trading hours
- Market(s) and instrument(s)
- Risk exposure per trade
- Reasons that preclude trading
Do not include general rules like “trade if momentum is favorable.” No computer can test an ambiguous rule.
2. Establish a Suitable Historical Dataset
Quality of a test is largely determined by the quality of data it uses.
Check if the dataset has:
- Sufficient historical periods
- Accurate prices
- Appropriate timestamps
- Corporate-action adjustments where relevant
- Realistic market sessions
- Adequate coverage of different market environments
Data quality is especially critical for intraday trading systems as even slight price differences may influence entries/exit and trading simulation results.
3. Start With Backtesting
By backtesting trading strategies, traders can implement the set rules on the past information and check out how the system will behave.
But the backtest should be realistic, and that means transaction costs such as commission, spread, and slippage should be taken into account instead of using the price from the quote window.
A useful backtest should answer questions such as:
- How many trades occurred?
- What was the average trade?
- How large was the worst drawdown?
- Were profits concentrated in a small number of trades?
- Did the system survive unfavorable periods?
- How sensitive were results to trading costs?
4. Separate Development From Evaluation Data
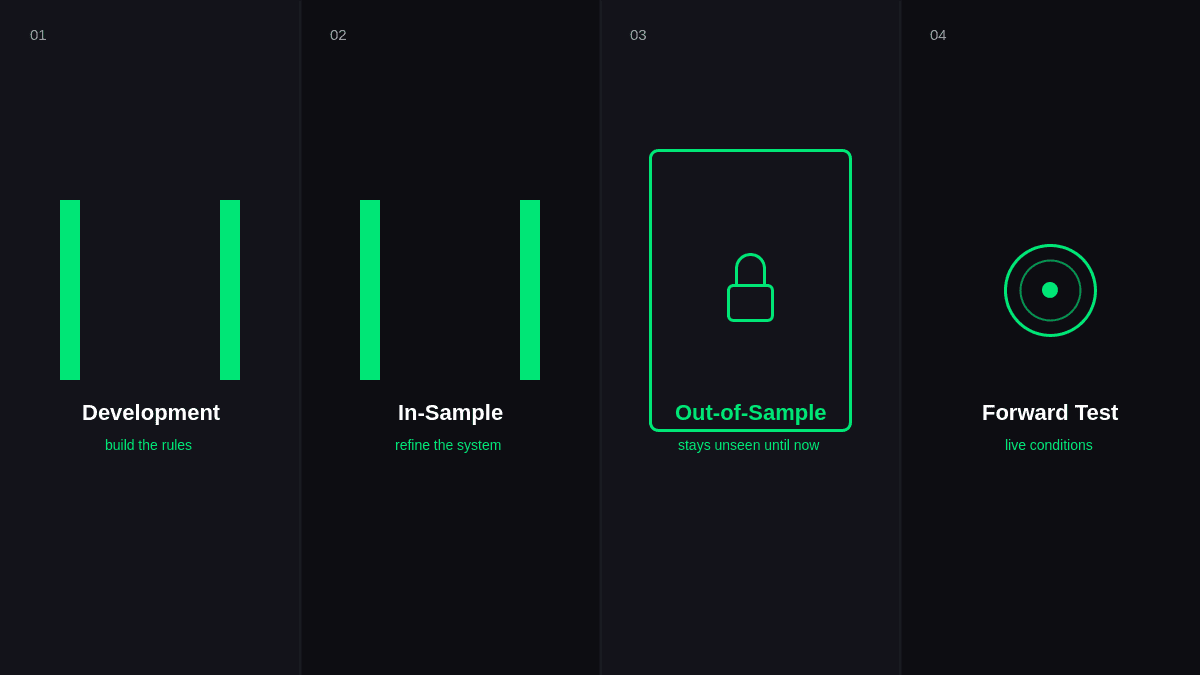
One of the best ways to prevent overfitting is to split historical data into various stages.
Some basic stages would be:
| Testing Stage | Purpose | What to Look For |
|---|---|---|
| Development data | Build the initial rules | Logical and consistent behavior |
| In-sample test | Refine the system | Sustainable improvement |
| Out-of-sample test | Evaluate unseen data | Similar behavior without retuning |
| Forward test | Observe live or simulated execution | Realistic operational performance |
The key thing here is that the unseen data needs to stay unseen when developing the strategy.
5. Measure Strategy Performance Metrics Alongside Risk
Return is only one of the elements for assessing strategy performance. If a system delivers a high return rate annually, it doesn’t mean that this system will work well because the system might involve too many drawdowns, make too few transactions or depend on several trades with extraordinary profits.
The important strategy performance measures must be considered simultaneously.
1: Net Return
Net return reflects the profit/loss of the system, calculated according to all the conditions of testing.
This measure gives information about profitability of the system but says nothing about risk involved in its realization.
For example, the 40% return with 50% drawdown can be worse than 25% return with 15% drawdown.
2: Maximum Drawdown
The maximum drawdown is the largest peak to trough drawdown in the performance of the strategy's equity curve.
This answers an important question:
How much money could the strategy lose in a tough environment?
It is important to assess the maximum drawdown in relation to the amount of risk which the trader/portfolio is able to take.
3: Profit Factor
Profit factor is the ratio of gross profits to gross losses.
Any ratio greater than 1 means that the gross profits were greater than the gross losses during the test period.
But it would be a mistake to evaluate the profit factor in isolation. A very high ratio, formed based on only a few deals, might serve as less proof than a somewhat lower one based on hundreds of deals.
4: Average Trade
Average trade is the average profit/loss per trade.
It will help to compare the expected value of each deal against transaction costs.
If the average trade is slightly higher than the expected commission, spread, and slippage, the system lacks the necessary economic margin to make it work.
5: Win Rate
Win rate refers to the percent of trades which have been profitable.
A high win rate doesn’t imply that the strategy is good. It could be true that a strategy wins often but makes heavy losses when it loses.
For instance, there could be a strategy with 70% win rate but which is still not profitable due to larger losses compared to gains.
6: Average Win-to-Loss Ratio
Average winning and losing trades add further meaning to the win rate.
A strategy that has a low win rate could still be profitable in case the average size of the winning trade exceeds the average size of the losing trade.
Hence, the win rate must always be considered together with average win, average loss, and expectancy.
7: Sharpe Ratio
The Sharpe ratio measures performance by examining the returns against the level of variation in these returns.
It may be used to compare different investment strategies, although its applicability is determined by how well the assumptions under which it was calculated are met.
8: Sortino Ratio
The Sortino ratio is similar to the Sharpe ratio, but it emphasizes downside risk.
It can be particularly effective when it is the negative aspect of returns that is the main focus.
9: Recovery Period
Maximum drawdown measures the magnitude of a fall, whereas the recovery period measures the length of time taken to recover to the previous equity high.
Two strategies may share similar drawdown percentages yet very different recovery periods.
10: Trade Count
The number of trades serves as a valuable factor for statistical significance.
A trading strategy which yielded an 80% return on 12 trades is not as conclusive as a strategy which has yielded a similar percentage in hundreds or thousands of trades.
A low number of trades leads to very volatile and sensitive performance statistics.
11: Expectancy
Expectancy is a measure that calculates the net value that a particular strategy can generate per trade by considering the historical win probability and win/loss amounts.
An easy method to calculate expectancy is:
Expectancy = (Win Rate × Average Win) − (Loss Rate × Average Loss)
A positive expectancy is useful evidence, but it still needs to be evaluated across different periods and under realistic costs.
Why Metrics Must Be Evaluated Together
No single metric can determine whether a strategy is reliable.
For example:
| Metric | What It Assists in Measuring | Potential Red Flag |
|---|---|---|
| Net return | Profitability | High net return but high risk too |
| Maximum drawdown | Downside risk | Maximum drawdown exceeds risk capacity |
| Profit factor | Return relative to losses | Inadequate profit factor |
| Win rate | Proportion of winning trades | High win rate and large losses |
| Average trade | Expected value of trade | Low average trade |
| Sharpe ratio | Risk adjusted returns | Low Sharpe ratio due to high volatility |
| Sortino ratio | Downside risk adjusted returns | Low sortino ratio due to poor downside efficiency |
| Expectancy | Expected result per trade | Negative expectancy |
| Trade count | Number of observations | Low number of trades |
| Recovery period | Recovery from losing trades | Long recovery period |
The objective is to build a complete performance profile, not to maximize one statistic.
6. Test for Overfitting
Overfitting happens when a strategy becomes too fitted to historical data and becomes ineffective on new data.
The most common red flags include:
- Very high returns in historical data
- Very specific parameter settings
- Big variations in performance from small changes in parameters
- Too many indicators and filters
- Very few losses in historical data
- Poor performance out of sample
- Poor performance after deducting real trading costs
- Dependence on one specific period of historical data
- A strategy that works only for one market or one timeframe
For instance, if a strategy is very effective at 23 moving average settings and totally fails at 22 or 24 settings, then it requires more attention.
Good strategies should have reasonable ranges of parameter settings that show similar behavior.
7. Test the Strategy Across Different Market Conditions
An approach must not be evaluated only by its performance in times when market conditions were favorable.
Check how the approach performs in:
- Bull market cycles
- Bear market cycles
- Siding markets
- Times of high market volatility
- Times of low market volatility
- Market reversal periods
- Market shock periods
- Liquidity changes
This is especially crucial as various approaches work well in different environments.
For instance, a trend following strategy might underperform during a long period of siding market environment. This does not necessarily mean that such an approach is wrong. What is much more important is whether the strategy maintains the risk profile in those periods.
8. Use Sensitivity Testing to Examine Robustness
Sensitivity tests include small, sensible changes in the strategy’s parameters to see if its general behavior is stable.
For instance, in case of a strategy using 20 periods of the moving average, test close parameters like 18, 19, 21, and 22. Assume that it does not have to be 20.
In case of consistency in performance, you will receive more robust results.
In case of instant loss of profitability at even slight modification of the parameter, the previous performance may heavily rely on historical data.
The goal of the sensitivity test is not to find another optimal parameter but rather see if the strategy can operate under sensible assumptions.
9. Use Walk-Forward Testing
The walk-forward test is an effective validation method that builds upon the basic in-sample and out-of-sample methodology.
Rather than formulating the strategy just once and then testing it against a single out-of-sample period, walk-forward testing involves breaking down the past data in many development and testing periods.
For instance:
- Build or define the strategy based on an early period of historical data.
- Test the generated rules against a new period of data.
- Advance the test period forward in time.
- Develop the strategy again based on the information up to this point.
- Test the new rules against a new unseen period of data.
- And repeat for all historical data.
Such a simple structure may appear like this:
| Walk-Forward Cycle | Development Period | Unseen Evaluation Period |
|---|---|---|
| 1 | Period 1 | Period 2 |
| 2 | Periods 1–2 | Period 3+ |
| 3 | Periods 2–3 | Period 4 |
| 4 | Periods 3–4 | Period 5 |
The exact structure varies from the strategy and the market.
Walk-forward optimization allows for a more practical question to be answered:
Will the strategy be able to maintain its performance while constantly being exposed to new data from the market?
It can even reveal strategies that appear robust in one backtest but become flawed once tested over multiple time periods.
10. Perform Stress Testing
Stress test measures the sensitivity of the strategy to adverse assumptions.
For instance, increase in:
- Slippage
- Commissions
- Spreads
- Execution time
- Volatility
- Constraints on position sizing
Afterwards, you may see if the strategy still holds its validity.
The strategy which still works profitably with slightly adverse assumptions speaks more than a strategy which becomes unprofitable after a slight increase in transaction costs.
Stress test is very crucial especially for strategies with small average deal size and high trading frequency.
11. Consider Monte Carlo Analysis
The use of Monte Carlo analysis can offer a different perspective on the strategy risk by creating alternate scenarios from the characteristics of past trades in the strategy.
While the past trading sequence is taken into consideration, simulations can also test alternate trade orders and outcomes.
The range that can be calculated includes:
- Drawdowns
- Loss streaks
- Returns
- Variation of the equity curve
- Risk of losing capital significantly
The Monte Carlo analysis results must not be considered predictive but rather an instrument to measure the sensitivity of the strategy to various outcomes.
12. Conduct Out-of-Sample Testing
The out-of-sample test is a way to test a strategy based on data that was deliberately not used in the process of developing the rules.
This could mean using one segment of the historical data for development and another one just for testing.
A strategy must be tested using the other segment of data without altering the rules because it gives unsatisfactory results.
If the out-of-sample performance is excellent, this doesn't necessarily mean future success, but a drastic drop in comparison to in-sample results may imply overfitting or an inferior edge.
13. Forward Test Before Risking Real Capital
Forward testing tests the strategy on fresh market data following the development and backtesting phases.
This can be done either by paper trading or otherwise through some simulated scenario before deploying real money.
Forward testing may expose some practical problems like:
- Signal timing
- Order execution
- Slippage
- Data lag
- Position sizing
- Execution constraints
- Platform issues
- Operational problems
- Market surprises
The rules need to be kept constant in the entire test unless there is any justified need to start the testing process again.
Changing the system constantly in the forward testing phase makes it very hard to ascertain the working of the system itself.
Backtesting vs Out-of-Sample vs Walk-Forward vs Forward Testing
These methods are related but serve different purposes.
| Method | Main Objective | Use New/Unknown Data? |
|---|---|---|
| Backtesting | Analyze Past Performance | No |
| In-Sample Testing | Construct Rules | No |
| Out-of-Sample Testing | Analyze Unknown Past Data | Yes |
| Walk-Forward Testing | Test Strategy Across Rolling Data Periods | Yes |
Using several of these methods together creates stronger evidence than relying on a single historical backtest.
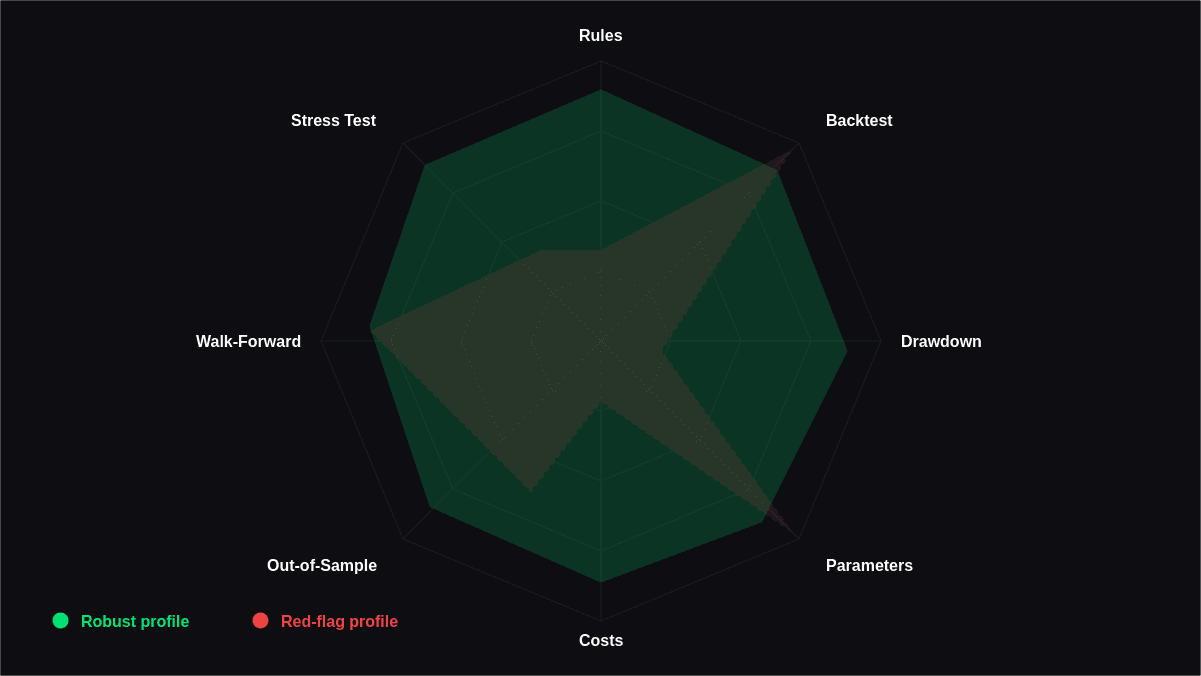
What Makes a Trading Strategy Worth Deploying?
There is no universal performance threshold that guarantees a strategy will succeed in live markets.
Instead, evaluate several dimensions together.
| Validation Area | More Robust Evidence | Red Flag |
|---|---|---|
| Rules | Reliable and repeatable | Arbitrary judgment calls |
| Backtest | Consistency over time periods | A very profitable time period |
| Drawdown | Consistent with set risk tolerance | Unnaturally high drawdown |
| Parameters | Constant over close-by values | Ultra-sensitive parameters |
| Costs | Actual commission costs | No cost consideration |
| Out-of-sample | Consistent behavior | Performance deterioration |
| Walk-forward | Consistency over many windows | Deterioration over time |
| Stress Test | Maintains viability with tougher conditions | The edge goes away fast |
| Trade Count | Enough samples | Very low trade frequency |
| Forward Test | Validates past results | Performance deterioration |
This changes the question from:
“Did the strategy make money?”
to:
“Why did it make money, and does the evidence suggest that the underlying behavior may persist?”
Common Mistakes During Strategy Validation
Even the most sound process may fail due to faulty methodology.
Do not:
- Change rules after each loss
- Choose only profitable periods in history
- Forget about commissions and slippage
- Incorporate future information unintentionally
- Test many strategies and choose the best out of them
- Evaluate the strategy based on a small number of trades
- Reuse out-of-sample data for optimization purposes
- Ignore changes in market regimes
- Treat paper trading as a guarantee of real performance
- Pay attention only to annualized gains
- Optimize based on only one performance measure
- Assume that the previous correlation stays constant
The proper validation process needs to be designed before backtesting.
When Should You Reject a Trading Strategy?
Not all strategies require additional optimization.
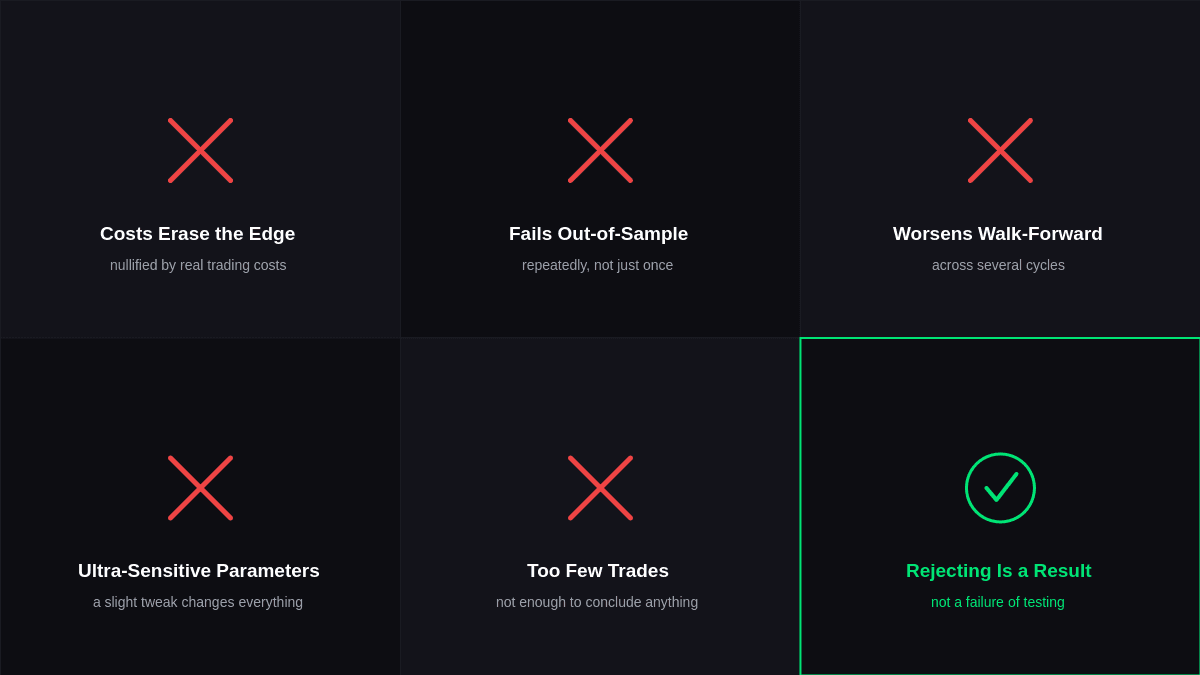
It may be worthwhile to reject a strategy if:
- Its edge becomes nullified by real trading costs.
- It fails repeatedly with out-of-sample data.
- Walk forward testing results worsen through several cycles.
- A slight variation in parameters changes its performance entirely.
- Its drawdowns surpass acceptable risk thresholds.
- Its performance depends greatly on just one period in history.
- It makes too few trades to form any conclusions.
- Stress testing results in losing profitability.
- It relies on impractical assumptions for execution.
- Rejecting a bad strategy is a good result of validation.
The goal of testing is not to prove every trading idea to be profitable. It is to decide which ideas have enough evidence behind them to develop further and which should be abandoned.
Conclusion
When assessing a trading strategy, the objective is not to show that the system will be profitable all the time. Instead, it is to establish if there is enough evidence to have reasonable assurance that the strategy can function in realistic market environments.
Begin with well-defined rules, valid data, consideration of transaction costs, risk assessment, testing across unseen timeframes, parameter sensitivity analysis, and forward testing. This methodology does not guarantee certainty, but it reveals many flaws before it turns out to be a costly experience.
Thus, the optimal validation process consists not so much of searching for the best backtest as gathering independent proof.
FAQs
1. How long should I backtest a trading strategy?
There is no universal period that works for every strategy. The dataset should be long enough to include multiple market conditions and a sufficient number of trades. Short-term strategies generally need enough intraday observations to capture different volatility and liquidity environments.
2. What is the most important metric when validating a strategy?
There is no single best metric. Maximum drawdown, profit factor, average trade, risk-adjusted returns, trade count, and consistency should be considered together. A high return alone does not establish that a strategy is robust.
3. What is the difference between backtesting and forward testing?
Backtesting applies trading rules to historical data, while forward testing evaluates the strategy using new market data after the development process. Forward testing can reveal practical issues that may not appear in historical simulations.
4. How can I tell if my strategy is overfit?
Look for unusually specific parameters, dramatic performance changes from minor setting adjustments, excessive filters, very high historical performance, and weak results on unseen data. These characteristics can indicate that the system has adapted too closely to historical noise.
5. Can strategy validation guarantee future profits?
No. Validation reduces uncertainty; it does not eliminate it. Market conditions can change, execution can differ from simulations, and previously successful relationships can weaken. A validated strategy should still operate within predefined risk limits