Technical indicators allow traders to convert market data into understandable information. The trader does not have to consider all movements separately but can perform certain computations to analyze the trend, momentum, volatility, and volume of trades.
However, for a beginner, just knowing the name of the indicator is not sufficient. Every indicator has its unique application and limitations. Usage of multiple indicators without proper knowledge may lead to further confusion.
This article discusses the basic details about indicators, the different types of trading indicators for beginners, and their usage in a systematic trading method.
What Are Technical Indicators?
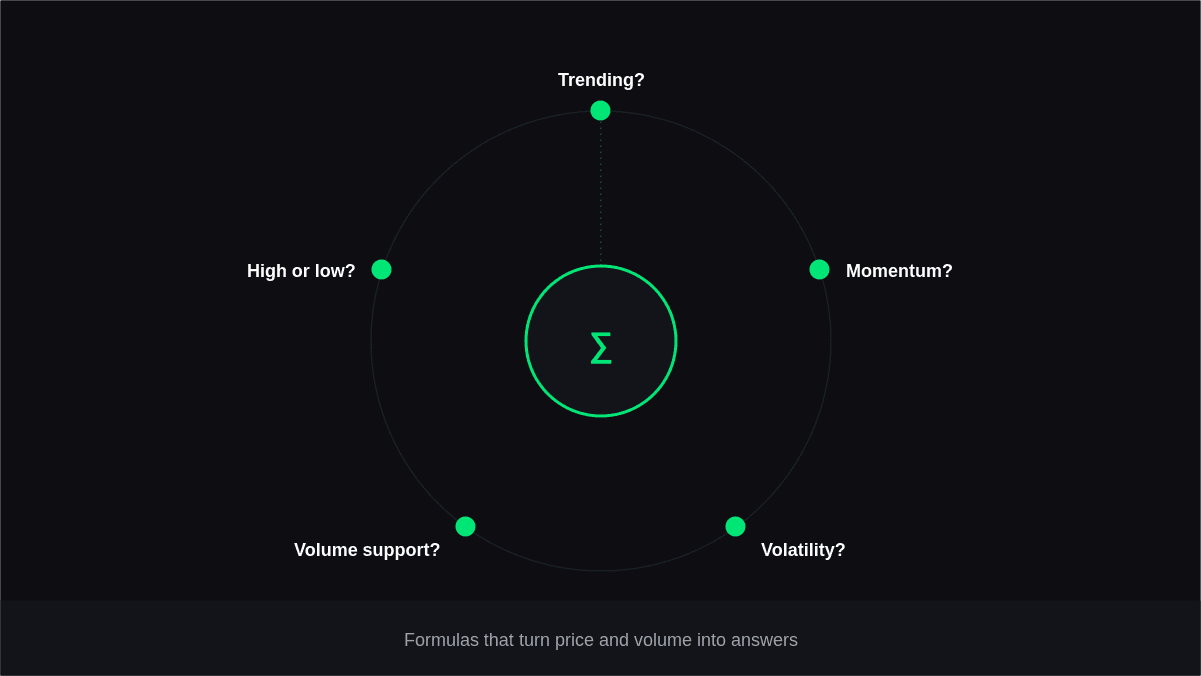
Technical indicators are mathematical formulas derived from data about the market, mainly price and volume. They convert the data into charts, bands, oscillators, etc., that could help traders analyze the movements in the market.
Different indicators serve various purposes. For instance:
- Is the market trending?
- Is momentum increasing or decreasing?
- How volatile is the current market?
- Is trading activity supporting a price movement?
- Is the current price relatively high or low compared with recent prices?
The important point is that indicators analyze market information rather than predict the future with certainty.
Main Types of Technical Indicators
There are hundreds of indicators available on modern charting platforms, but beginners only need to understand a few major categories.
| Type | What it helps analyze | Examples |
|---|---|---|
| Trend | Direction of price movement | Moving Average, MACD |
| Momentum | Strength of price movement | RSI, Stochastic |
| Volatility | Size of price fluctuations | ATR, Bollinger Bands |
| Volume | Trading activity | OBV, Volume |
Understanding these categories makes it easier to choose an appropriate tool instead of adding indicators randomly.
5 Popular Indicators Every Beginner Should Know
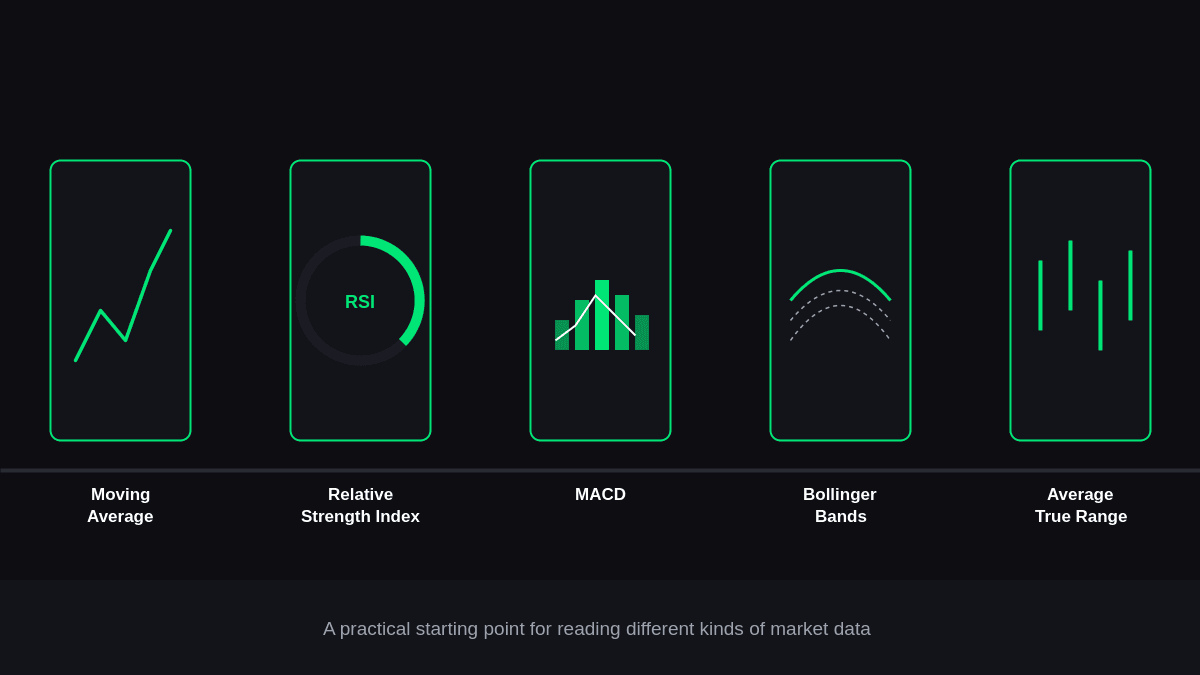
The following indicators provide a practical starting point for learning how different types of market data can support technical analysis.
1: Moving Averages
Moving averages work through smoothing of price series through averaging of a certain number of periods. They may help reveal the overall trend of prices.
The Simple Moving Average assigns equal weighting to the data used in calculations. The Exponential Moving Average gives more weighting to the recent prices.
Moving averages are often used by traders to analyze trends, find out dynamic support or resistance levels, and compare the current price with its average price.
However, it is not necessary to consider moving the average cross as a signal for buying or selling.
2: Relative Strength Index
RSI, which is short for Relative Strength Index, is a momentum indicator that runs from 0 to 100.
Classical analysis considers values over 70 to be overbought and values under 30 to be oversold. Nevertheless, these values do not indicate the upcoming reversal automatically.
RSI can stay overextended in a strong trend for quite some time. This must be taken into account by beginners in technical analysis.
3: MACD
MACD stands for Moving Average Convergence Divergence. It is a trend-following indicator that makes use of moving averages to analyze momentum and trends behavior.
It is common for traders to look at the interaction between the lines and histogram of the MACD, as well as divergence between the price and the MACD. Because of the nature of MACD, it can act on past data and thus act after the trend has started.
4: Bollinger Bands
Bollinger Bands consist of a moving average with upper and lower bands based on volatility.
The wider they become, the higher the level of volatility, and vice versa. This feature can be helpful for analysis of changing market environments.
It is typical for beginners to think that contact with an upper band inevitably leads to price falling and contact with a lower band, to rising. However, it is not the case.
5: Average True Range
The Average True Range is also known as ATR and is used to gauge the market volatility. While many technical indicators do predict the trend direction that the market will take, ATR does not show any trend direction of the market.
It shows the average range of movement for a chosen period of time.
How to Use Technical Indicators
Learning how to use technical indicators effectively starts with identifying the question you want the chart to answer.
Instead of adding multiple tools first, follow a simple process:
Identify the market condition. Determine whether price is trending, ranging, or moving irregularly.
Choose your objective. Decide whether you need information about trend, momentum, volatility, or volume.
Select a suitable indicator. Choose a tool that directly addresses that objective.
Compare it with price action. Avoid interpreting the indicator independently.
Create clear rules. Define what constitutes a setup and what invalidates it.
Test the approach. Review historical examples before risking real capital.
This process helps keep indicators in a supporting role rather than allowing them to control every trading decision.
How Technical Analysis Indicators Work Together
Use of technical analysis indicators does not require the use of as many indicators as possible. The right thing to do is to select indicators that will offer distinct information.
For instance, a moving average will help one analyze the overall trend, while RSI will offer information on momentum. ATR will, then, give information on volatility.
Thus, this will make the analysis more well-rounded since each indicator will play its own part.
It all boils down to avoiding repetition. Using three momentum indicators will offer distinct information but all pointing at the same thing.
Building a Simple Beginner Setup
Beginners do not need a complicated chart to start learning. A simple setup could contain:
- One trend indicator, such as a moving average
- One momentum indicator, such as RSI
- Price action and market structure
- Volume where reliable volume data is available
- Clearly defined risk-management rules
The objective is to understand how each component contributes to the decision.
Before using a strategy with real money, traders can evaluate it using historical data and paper trading. This can reveal whether the rules are actually practical rather than simply looking attractive on a chart.
Common Mistakes Beginners Make
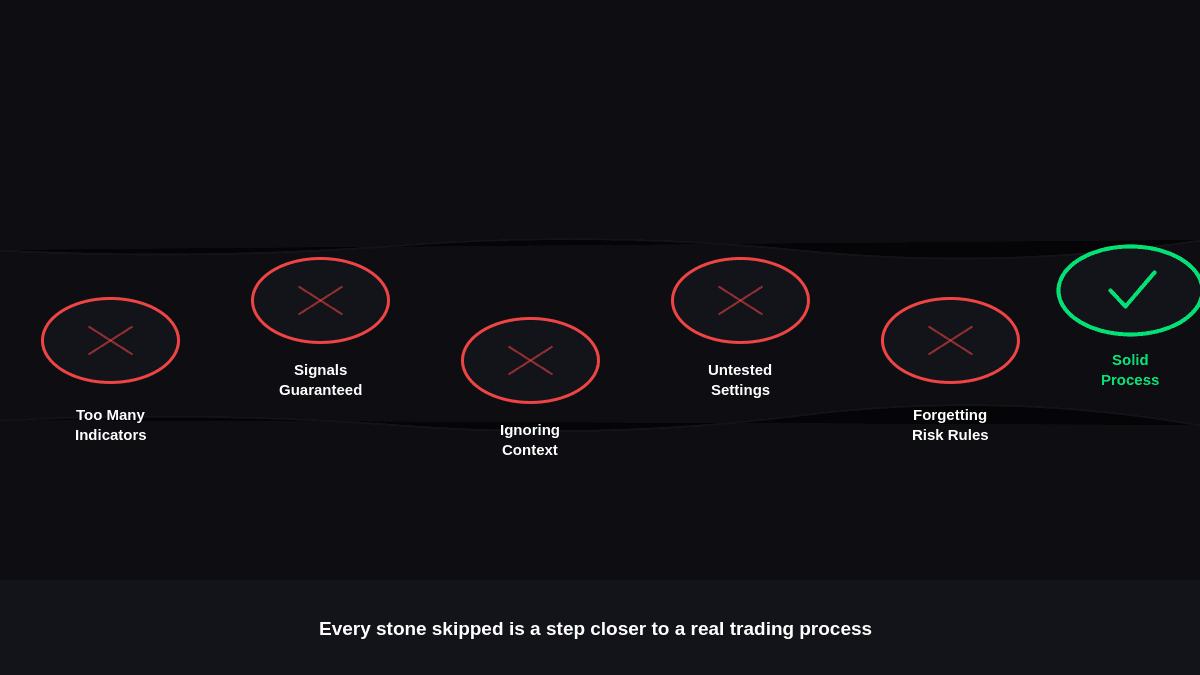
Beginners can make indicator-based analysis unnecessarily complicated by relying too heavily on signals. Keeping the approach simple and understanding each tool's purpose can help avoid common errors.
- Using too many indicators
- Treating signals as guaranteed
- Ignoring market context
- Changing settings without testing
- Forgetting risk management
Final Thoughts
Technical indicators may assist in bringing more structure to market analysis by turning prices and volumes into measurable information. Technical indicators can be used to analyze such things as trends, momentum, volatility, and trade activity; however, technical indicators cannot predict the future market behavior.
The optimal way of learning for novices is starting from scratch. Novices should know what each indicator does, how it works, and how its signals differ from those of the price itself.
It is much better to look for a system that would include everything, including indicators, rules, tests, and risk control, than to try to find a system of indicators generating perfect signals.