Support and resistance levels are widely used in technical analysis because they show potential price levels at which buying or selling pressure is likely to change.Support and resistance levels can be formed around previous highs and lows, consolidation zones, trendlines, and other areas where price has reacted numerous times.
However, not every level that appears on the price chart is significant. Stronger analysis is achieved through a combination of how price reacts to a level, how many times the level has been tested, and the overall structure of the market.
We will study in this guide methods of identifying support and resistance levels and determining the strength of the support and resistance levels and how to use support and resistance levels to build trades that are more planned and deliberate. We will avoid building trades because the level looks significant on the price chart.
What Are Support and Resistance?
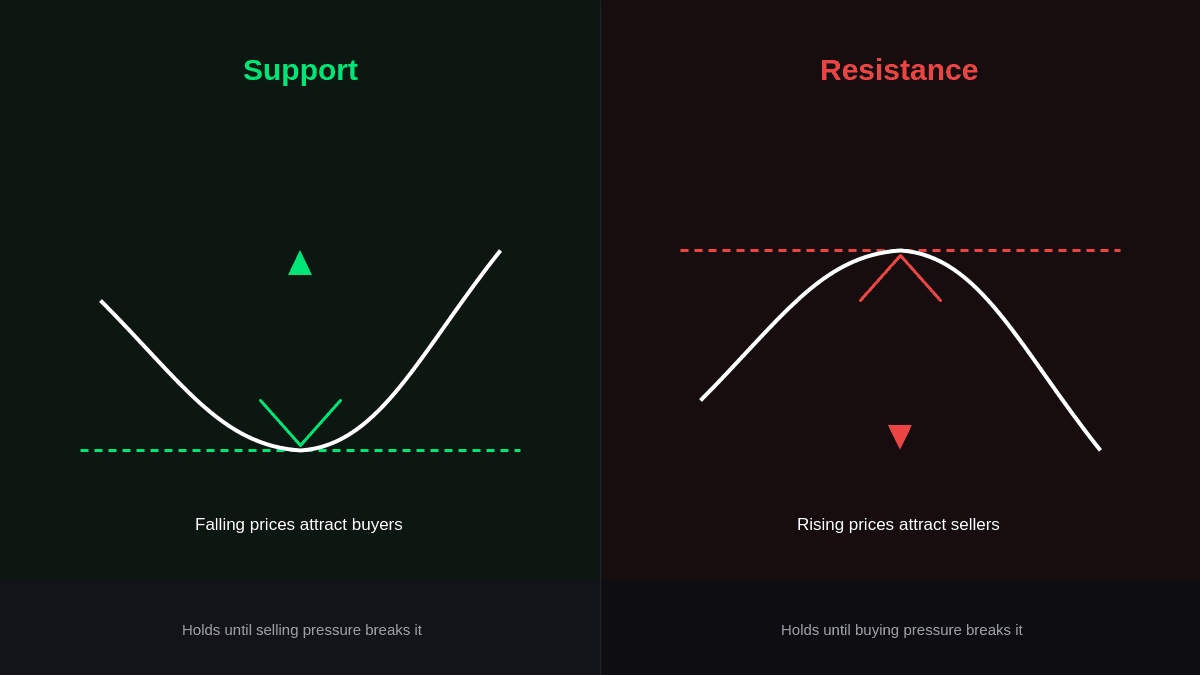
Support and resistance levels assist traders in finding areas where there have been reactions to buying or selling pressures. Support and resistance levels should not be taken as definite price levels, but rather as potential areas of reaction.
Support
Support represents a price level where falling prices have attracted sufficient buying activity in the past to halt the fall. Traders might look at past lows, consolidation zones, or any other place where buying activity was evident.
If price moves back into the support level, buying activity may develop since the zone has already held up in the past. However, support levels will not hold if there is sufficient selling pressure that drives prices below the support.
Resistance
Resistance refers to an area where the increasing price action has seen selling pressure that has resulted in the stall or reversal of the bullish trend. Highs made in the past, consolidation zones, among others, can be viewed as possible resistance points.
As price nears the resistance level, traders may watch out for any indications of selling action. As with the support levels, there is no assurance that resistance will always hold up since it can be violated by strong buying pressure.
Key Concepts in Support and Resistance Trading
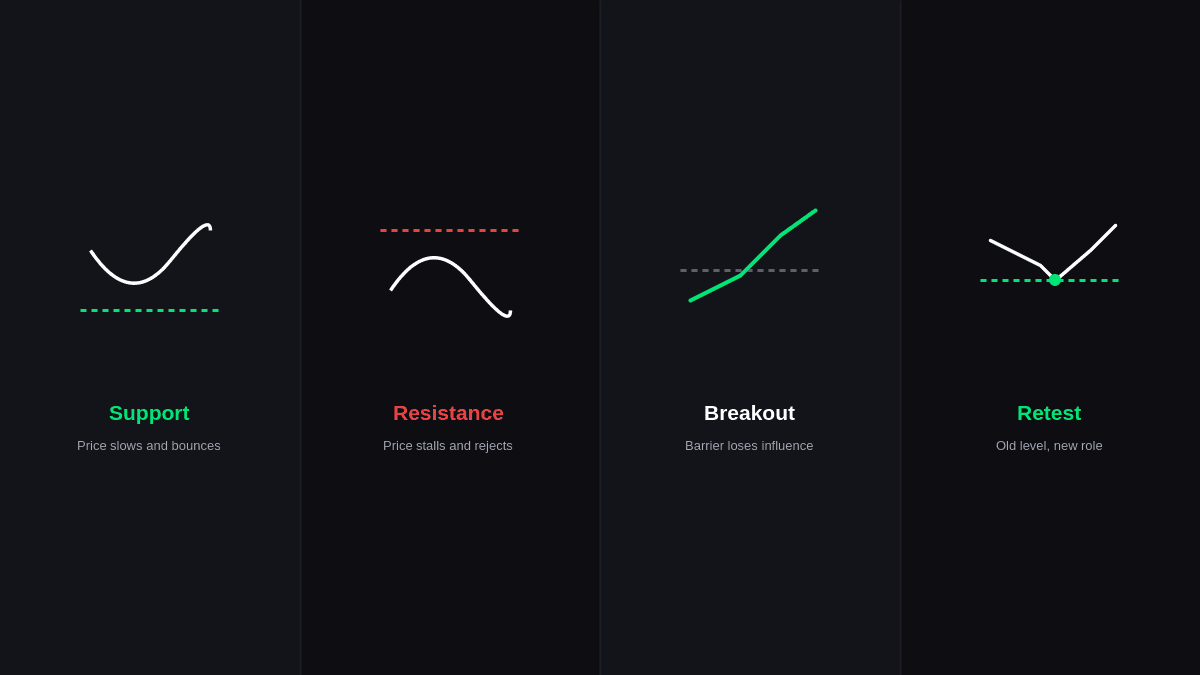
In support and resistance analysis, there is much more involved than simply locating levels where the price may change its direction. Traders must also examine the behavior of prices in relation to those levels.
The following concepts help explain the different ways price can interact with support and resistance levels:
| Concept | What It Represents | Typical Price Behavior | What Traders Watch |
|---|---|---|---|
| Support | Area where buying interest may increase | Price may slow, bounce, or consolidate | Rejection, volume, previous lows |
| Resistance | Area where selling interest may increase | Price may stall, reject, or consolidate | Rejection, volume, previous highs |
| Breakout | Price moves decisively beyond a zone | Previous barrier may lose influence | Candle close, momentum, follow-through |
| Retest | Price returns to a broken level | Former resistance may act as support, or vice versa | Reaction after the retest |
How Support and Resistance Levels Form
The past price movement has created these areas. Repeated reactions to the same area will draw more attention of traders to such an area.
Previous swing high could be treated as resistance since the sellers entered the market at that level before. The same logic is true for swing lows, which become support zones.
There are other criteria, which can reinforce a zone.
- Multiple reactions from a similar price area
- Strong moves originating from the zone
- Previous consolidation before a breakout
- Significant swing highs or lows
- Higher-timeframe price structure
- Increased trading activity around the area
Not all highs and lows seen deserve to be considered equally. Levels that have made an impact on the movement of prices tend to be more important than small levels of oscillations.
How Traders Can Find Reliable Support and Resistance Zones
Finding reliable zones involves looking beyond individual highs and lows. Traders can examine previous price reactions, repeated tests, market structure, and higher-timeframe levels to identify areas that have shown meaningful buying or selling interest.
A support resistance indicator can also help highlight potential zones, but traders should still evaluate the underlying price action before considering a marked area significant.
- Previous price reactions: Look for areas where price has previously reversed, stalled, or consolidated.
- Multiple touches: Zones tested several times may provide stronger evidence of market interest.
- Market structure: Previous swing highs, swing lows, and consolidation areas can help identify relevant zones.
- Higher-timeframe levels: Zones visible on higher timeframes may carry greater significance.
How Traders Can Use Support and Resistance Zones
Once a potential zone is identified, traders can observe how price behaves when it approaches the area. Rather than assuming that support or resistance will automatically hold, they can wait for additional confirmation before making a trading decision.
A support resistance trading strategy can use these reactions alongside market structure, momentum, and other signals rather than treating every zone as an automatic entry point.
- Watch for rejection: A clear rejection can indicate that buying or selling pressure is entering the market.
- Monitor breakouts: A decisive move through a zone may signal that the previous level is losing influence.
- Look for retests: After a breakout, price may return to the broken zone and test it again.
- Consider market context: Traders can combine zones with trend direction, momentum, and other technical signals.
Mistakes Traders Should Avoid
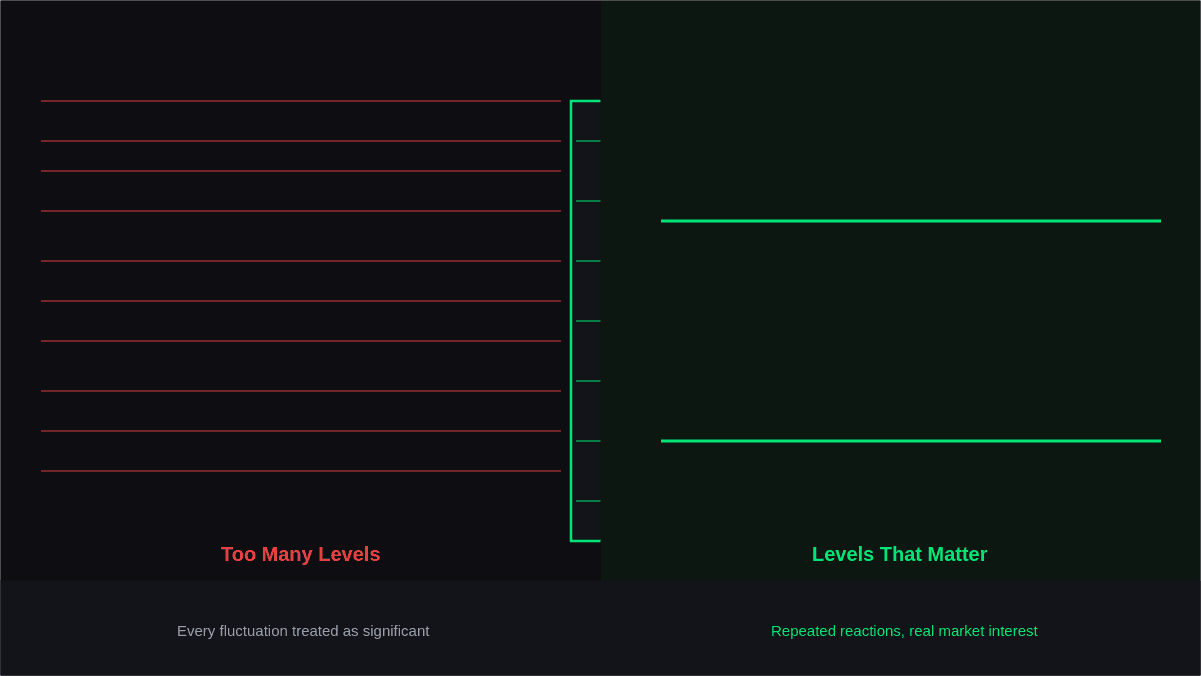
Support and resistance analysis becomes less effective when traders treat every level as equally important or assume price must reverse from a marked zone.
Common mistakes include:
- Drawing too many levels: Excessive markings can make the chart difficult to interpret.
- Treating zones as exact prices: Normal price fluctuations can move beyond a level without invalidating the broader zone.
- Ignoring market context: A level behaves differently in a strong trend than it does inside a range.
- Entering without confirmation: Reaching a zone alone does not establish a trade setup.
- Forgetting risk management: Even a well-defined technical level can fail unexpectedly.
- Assuming every breakout is genuine: Short-lived moves beyond a zone can turn into false breakouts.
Keeping the analysis selective makes important areas easier to recognize.
Final Thoughts
Support resistance provides a practical framework for understanding where the forces of buying and selling have previously impacted the price action. Used appropriately, it could be very helpful in organizing your charts and finding important levels on the chart.
The best way to use support/resistance is not assuming that all zones will turn into reversals. You should look at how price reacts when it hits the zone, take into account market structure, and then define the risks before making your trading decision.