Financial models, trading systems, and investment analysis depend on data that behaves consistently over time. If the underlying numbers change unpredictably, contain structural problems, or lose reliability across different periods, conclusions drawn from them can become difficult to trust.
Stability of Financial Data refers to how consistently financial datasets maintain their statistical properties, relationships, and quality as market conditions and time periods change.
Testing data stability is therefore an important part of financial analysis. A dataset that appears reliable during one period may behave very differently during another, especially when markets experience volatility, economic shifts, or changes in reporting practices.
These checks can also help traders validate trading strategies using data that remains dependable across different market conditions.
In this blog, we will cover what stability means in financial data and eight practical ways to test whether a dataset remains dependable across different conditions.
What Does Stability of Financial Data Mean?
The Stability of Financial Data describes the consistency of a dataset's characteristics over time. This can include its distribution, volatility, relationships between variables, frequency of missing values, and susceptibility to unusual observations. Stable data does not necessarily mean that prices or returns remain constant.
Financial markets naturally fluctuate. Instead, stability concerns whether the underlying data-generating characteristics remain sufficiently consistent for analysis.
For example, a stock return series can experience large price movements while still maintaining relatively consistent statistical behavior.
Conversely, a dataset may show similar average returns while its volatility, correlations, or missing-value patterns change significantly, potentially affecting how technical indicators behave and are interpreted.
8 Ways to Consider When Testing Financial Data Stability
Testing stability requires more than checking whether values look reasonable on a chart. Different tests examine different aspects of the dataset, from basic quality issues to changes in statistical relationships.
1. Compare Data Distributions Across Periods
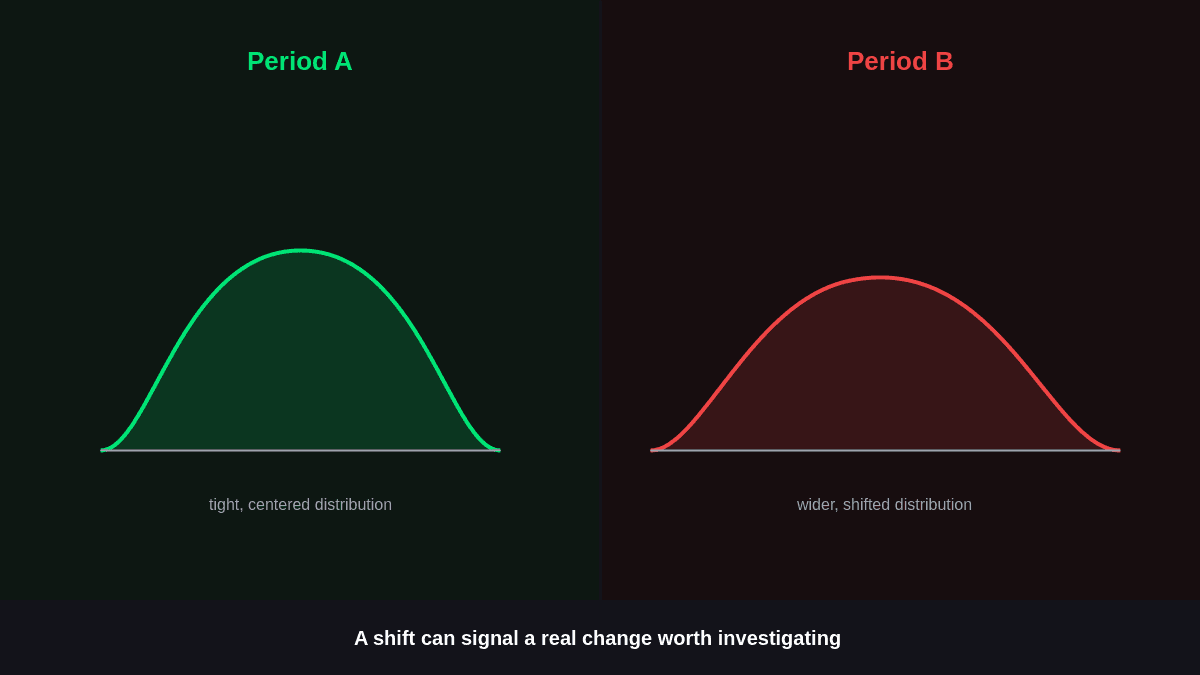
One practical starting point is to divide the dataset into separate time periods and compare their distributions. This can reveal whether the characteristics of the observations have changed.
- Compare mean, median, and standard deviation across periods.
- Examine whether return or price distributions have shifted.
- Compare skewness and kurtosis when analyzing return data.
- Use histograms or density plots to identify noticeable distribution changes.
- Investigate large differences instead of assuming they are normal market variation.
A substantial distribution shift may indicate a change in market conditions, data collection, or the underlying process generating the observations.
2. Monitor Rolling Statistical Measures
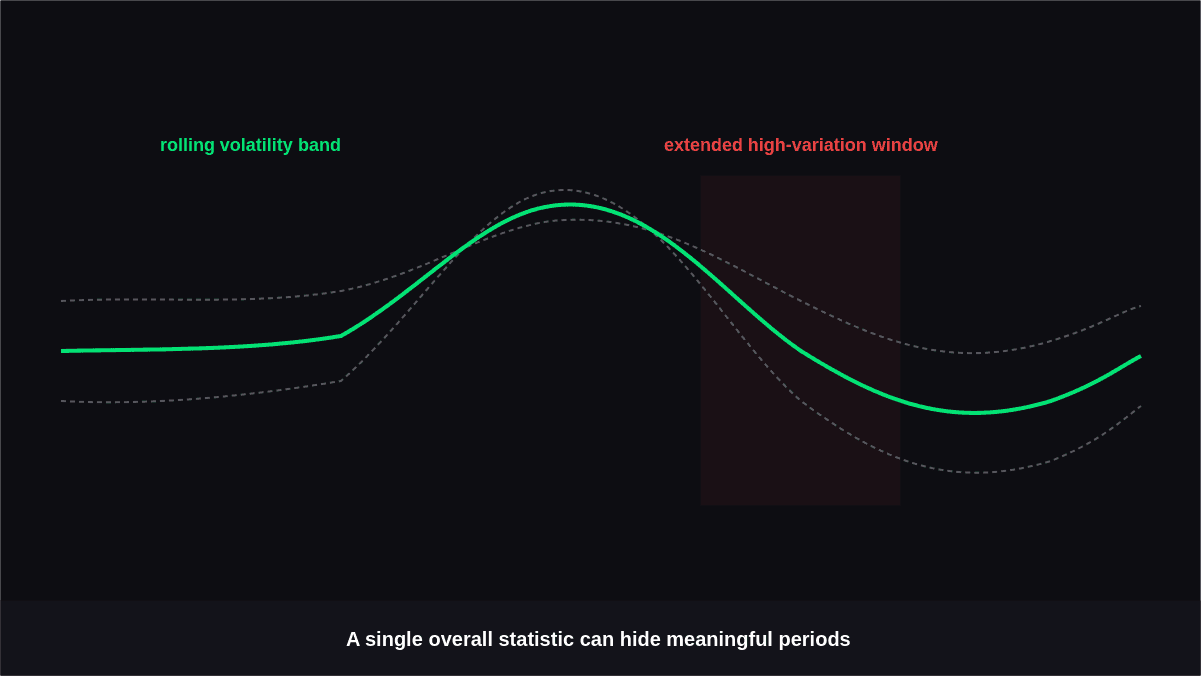
A single statistic calculated across an entire dataset can hide important changes. Rolling calculations provide a view of how characteristics evolve through time.
- Calculate rolling mean and standard deviation.
- Track rolling volatility for return series.
- Monitor moving correlations between relevant variables.
- Compare short-window and long-window statistics.
- Look for persistent changes rather than isolated spikes.
For example, a dataset can have moderate overall volatility while experiencing several extended periods of unusually high variation. Rolling analysis makes these periods easier to identify.
3. Check Missing Values and Data Gaps
Missing observations can affect both descriptive analysis and financial models. The pattern of missing data matters just as much as the total number of missing records.
- Calculate the percentage of missing observations in each variable.
- Identify specific dates or periods with unusual gaps.
- Check whether missing values are concentrated around particular market events.
- Look for differences in missingness between training and testing periods.
- Confirm that missing values were not accidentally replaced with misleading defaults.
Strong financial data quality requires understanding why information is missing rather than simply removing incomplete rows.
4. Investigate Outliers and Extreme Observations
Extreme values can represent genuine market events, recording errors, corporate actions, or problems with data processing. Removing them automatically can create another form of distortion.
- Identify unusually large positive and negative observations.
- Check the original source before treating an extreme value as an error.
- Compare suspicious prices with neighboring observations.
- Review unusually large volume or return figures.
- Determine whether corporate actions explain apparent price anomalies.
An effective stability check distinguishes legitimate market extremes from observations introduced through faulty data handling.
5. Test Relationships Between Financial Variables
Financial datasets often contain relationships between variables such as asset returns, interest rates, trading volume, and economic indicators. Those relationships may change over time.
- Calculate correlations across different periods.
- Compare relationships during calm and volatile markets.
- Examine whether predictive relationships remain consistent.
- Avoid assuming that historical correlation automatically persists.
- Investigate variables whose relationships change substantially.
This is particularly useful when a model depends on relationships between multiple financial inputs. A relationship that disappears outside the original sample may not provide a dependable foundation for future analysis.
6. Apply Time-Series Stability Tests
Time-series data has characteristics that ordinary cross-sectional data does not. Trends, autocorrelation, seasonality, and changing variance can affect statistical analysis.
- Test whether the series is stationary where appropriate.
- Examine autocorrelation across different lag periods.
- Check for persistent trends or changing variance.
- Difference or transform variables when analytically justified.
- Use appropriate time-series tests rather than relying only on visual inspection.
Financial data validation becomes more meaningful when the testing method matches the structure of the dataset. A price series, return series, and trading-volume series may require different treatment.
7. Look for Structural Breaks
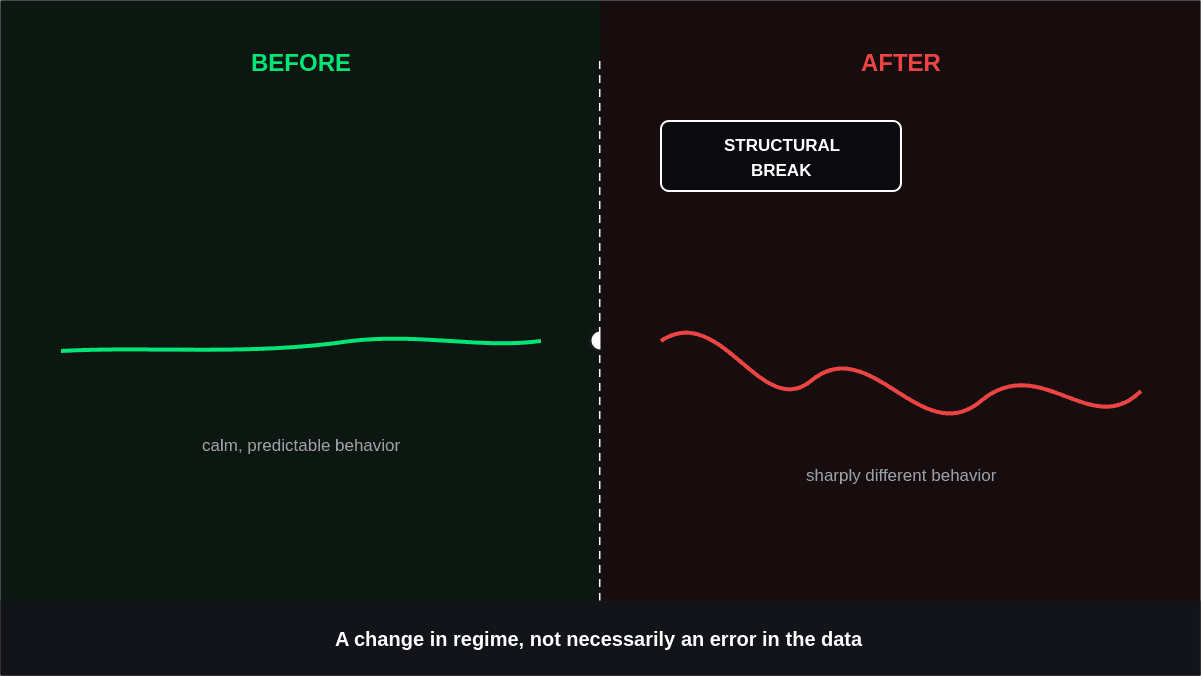
Financial datasets can experience sudden changes caused by events such as regulatory changes, market crises, changes in monetary policy, or modifications to data collection methods.
- Divide the dataset around suspected change points.
- Compare statistical properties before and after the event.
- Use structural-break tests where appropriate.
- Investigate whether the change is temporary or persistent.
- Document known events that coincide with major shifts.
A structural break does not automatically mean that the data is defective. It may instead indicate that the market environment itself has changed. Recognizing that distinction helps prevent legitimate economic changes from being mistaken for data errors.
8. Validate Patterns on Unseen Time Periods
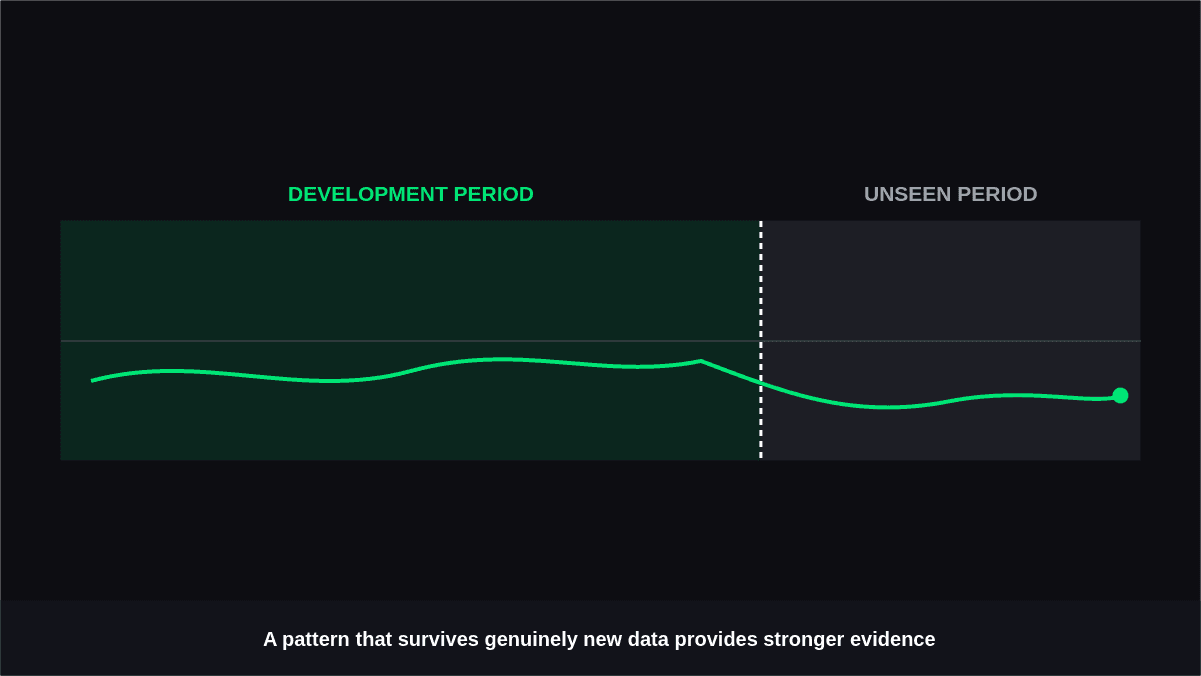
A dataset may appear stable because a model or analysis has been tested only on the same historical observations used during development. Testing on unseen periods provides a stronger check of whether observed relationships persist.
- Separate development data from evaluation data chronologically.
- Avoid randomly mixing future observations into the training period.
- Test the same methodology across multiple market environments.
- Compare performance and statistical characteristics between samples.
- Investigate large differences rather than focusing only on the average result.
This step connects stability testing with historical financial data analysis. A pattern that survives across genuinely unseen periods provides different evidence from one that exists only inside the original sample.
Why Stability Testing Matters for Financial Analysis
Unstable data can create problems at several stages of financial research. A model may learn relationships that were specific to one historical environment, while a trading strategy may appear effective because of temporary market conditions.
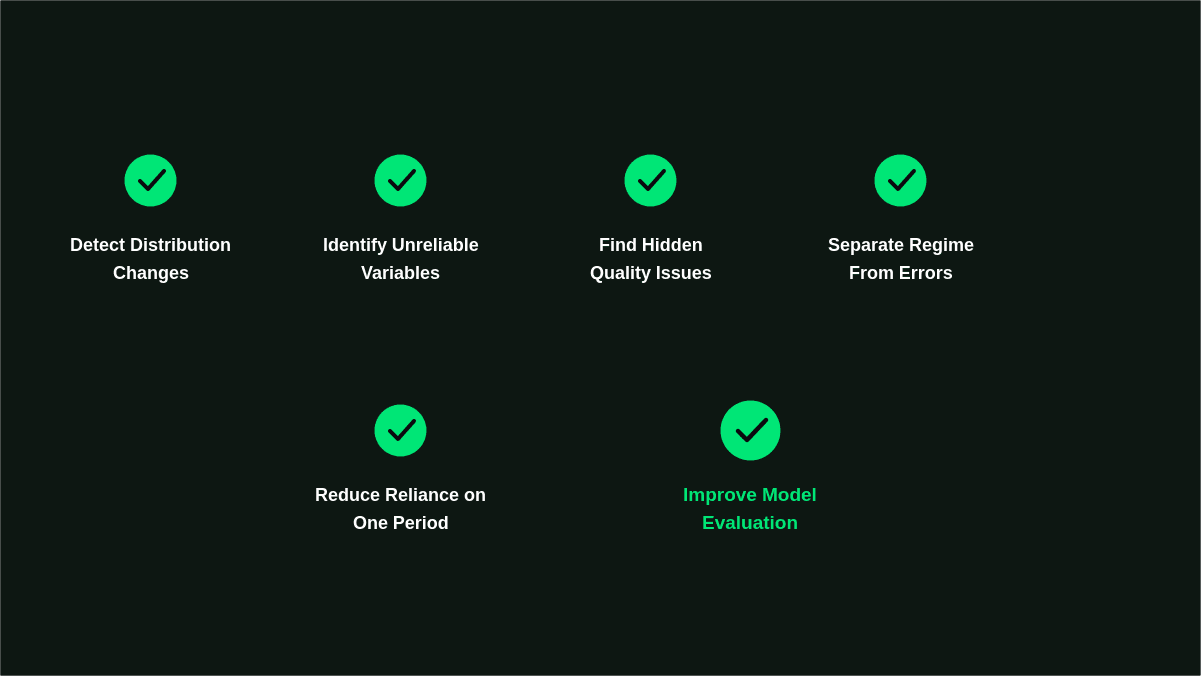
Regular stability checks can help analysts:
- Detects changes in data distributions.
- Identify unreliable variables.
- Find hidden data-quality issues.
- Separate market regime changes from technical errors.
- Reduce dependence on one historical period.
- Improve the reliability of model evaluation.
The objective is not to prove that financial data will remain unchanged. Markets evolve by nature. Instead, stability testing helps analysts understand how and where the dataset changes so those changes can be incorporated into the analysis.
Conclusion
Testing the Stability of Financial Data is an important step before relying on historical observations for financial research, modeling, or strategy evaluation.
Distribution comparisons, rolling statistics, missing-value checks, outlier analysis, relationship testing, time-series methods, structural-break detection, and in-sample vs out-of-sample testing each reveal a different type of instability.
No single test can establish that a dataset is dependable in every situation. Combining several methods provides a broader view of whether its characteristics remain consistent, where changes occur, and whether historical relationships continue across different periods.