Signals and overlays assist traders in transforming price action into information that is more comprehensible. Even though signaling systems point out situations that can be worth considering, overlays add information directly onto a price chart so that traders can analyze market direction, volatility, levels, or momentum.
There is a wide range of signaling systems and overlays used in today’s charting programs; however, applying more tools is not going to increase decision-making efficiency automatically. Overlays and signals covering an entire chart by means of arrows, lines, bands, and other indicators actually complicate the whole process of analysis when all of them have contradictory signals.
Knowing the role that each signal plays is more important than adding an extra one. The objective is to design a chart where all the indicators have a clear meaning and help to complete a specific trading process. In this blog, you will find everything you need to know related to signals and overlays.
What Are Signals and Overlays in Trading?
Overlays and signals are similar concepts, but their functions differ when analyzing the price chart. Here, you can find information on what overlays and signals are in trading, how they work, and what they allow traders to achieve.
Signals
A signal is an alert or visual indication that shows the existence of a pre-defined market situation. Signals can be defined in terms of price action, momentum, a shift in trends, breakouts, volume, or several conditions at once.
For instance, the occurrence of two moving averages crossing, or breaking a resistance level, can serve as signals to a trader that there is a situation worth analyzing, but no assurance that price will move in the expected manner.
Overlays
Overlays are analysis tools that are plotted directly on the primary price chart. They assist the trader in comparing the price action at the moment against factors like the trend direction, volatility, average price, or any significant support and resistance level.
Some common overlays are moving averages, VWAP, Bollinger Bands, trend lines, and Fibonacci levels. An overlay differs from a signal because the former is mainly used for comparison purposes.
Signals vs. Overlays: What Is the Difference?
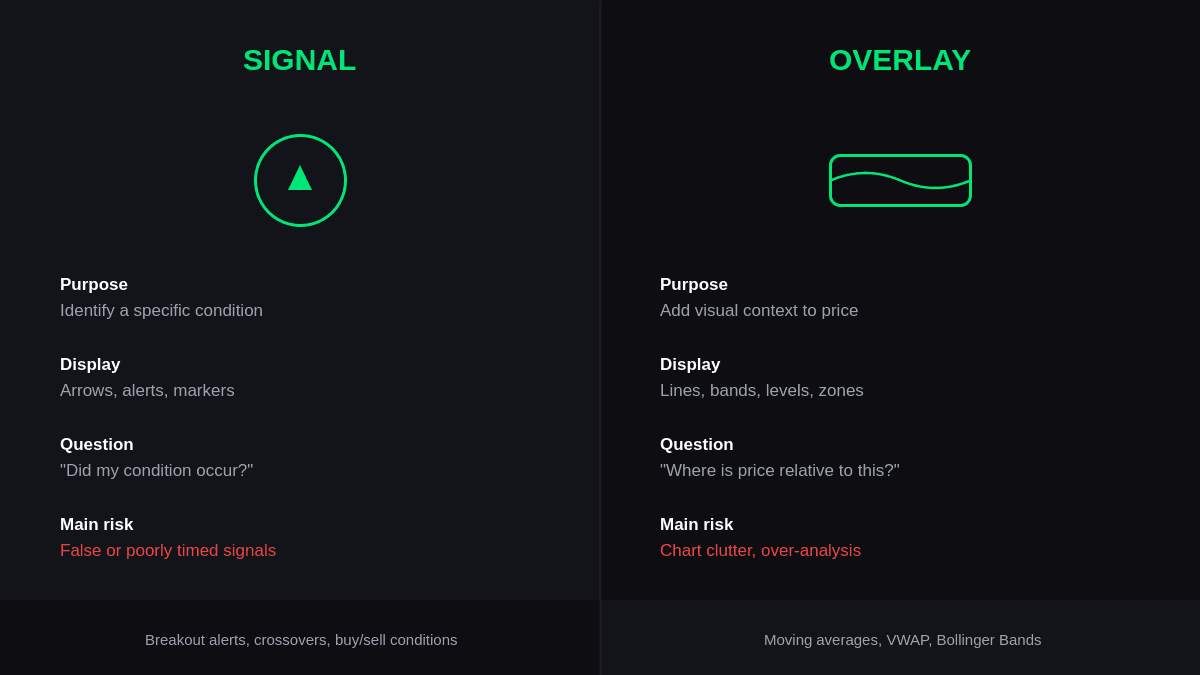
Signals and overlays are frequently used together, yet they shouldn’t be considered the same.
A signal is an event-based element, which notifies a trader about something occurring according to the system definition. An overlay is a context-based tool that helps traders assess the position of price compared to some reference.
To better understand, below is a comparison table:
| Feature | Signals | Overlays |
|---|---|---|
| Primary purpose | Identify a specific market condition | Add visual context to price |
| Typical display | Arrows, alerts, markers, labels | Lines, bands, levels, or zones |
| Main question answered | “Did my defined condition occur?” | “Where is the price relative to this reference?” |
| Common examples | Breakout alerts, crossovers, buy/sell conditions | Moving averages, VWAP, Bollinger Bands |
| Best application | Highlighting potential opportunities | Understanding trend, levels, or volatility |
| Main risk | False or poorly timed signals | Chart clutter and over-analysis |
For instance, a moving average could be an overlay indicating the overall direction of the price trend. The moving average crossover could form part of the signal rules.
The differentiation makes it possible for traders to avoid treating all the elements on the graph as trade instructions.
How Trading Signals Help Identify Market Opportunities
Trading signals become most effective when they are linked to certain procedures rather than being taken as automatic purchase or sale triggers.
For instance, various signals can play different roles such as:
- Trend signals: Identify possible continuation when price movement is along the known trend.
- Breakout signals: Indicate when price crosses the support, resistance, or trading ranges.
- Momentum signals: Show buying and selling pressure.
- Reversal signals: Show possible weakening of the current price movement.
However, a signal does not mean that the anticipated move will definitely happen.
Take the case of a resistance breakout. When a signal occurs after prices exceed resistance, the breakout attempt may be unsuccessful within a few seconds. Without further information, taking a trade based on a signal alone is quite risky.
An alternative way would be to identify what should take place before the formation of a signal. Some of the conditions may include:
- The price remaining above the breakout point
- Sufficient volume behind the move
- Conformity to the general market direction
- Evidence of confirmation through price behavior
- Defining an invalidation point or stop point
As such, the signal would not be the whole decision but just a portion of it.
How Chart Overlays Add Context to Price Movement
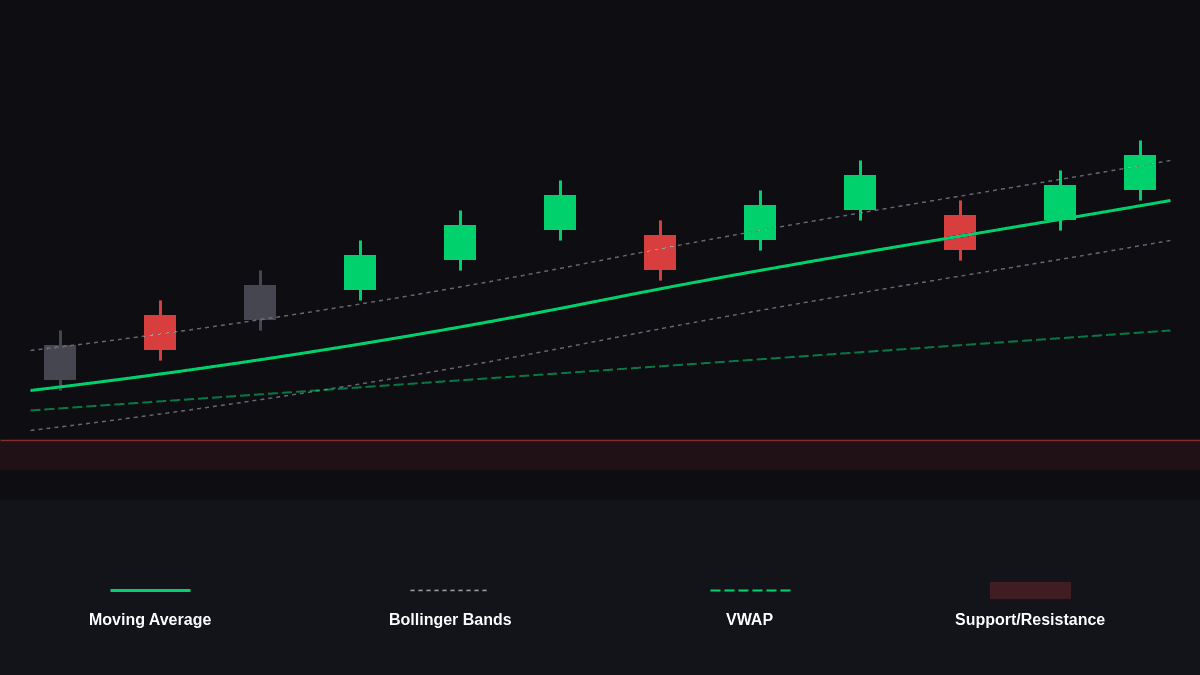
Chart overlays help traders analyze the price without stripping away the market structure. The overlay provides useful markers that are drawn right on the price chart, thus facilitating comparison of the present price move against the existing ones.
The following are examples of overlays, along with what information each overlay helps provide:
- Moving average: It smoothes out short-term price volatility and gives you a marker from which you can gauge the trend.
- VWAP: Assists intraday traders in comparing the current price to the volume-weighted average level.
- Bollinger Bands: Help in understanding volatility and how far away the price is from its moving average.
- Support and resistance: Point to areas where price had previously reacted.
Support and resistance overlays are also useful when assessing the validity of a signal relative to some important price level. For instance, if a breakout occurs in the vicinity of strong resistance, then the meaning of that signal will be quite different from a breakout occurring in the middle of a trading range.
The utility of any given overlay will really depend on the question it is answering. If an indicator is unable to add to the trader’s knowledge about price, trends, volatility, or market structure, there is probably no reason for keeping it.
Common Types of Signals Used by Traders
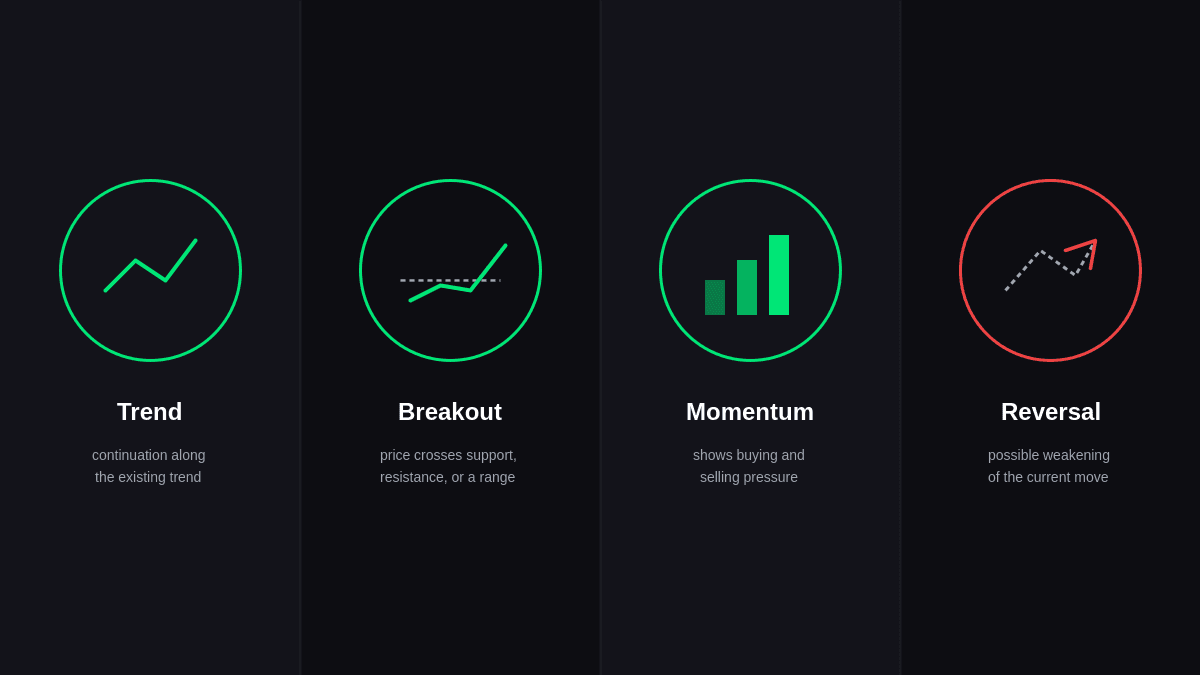
Various signals are created to pinpoint certain shifts in price action, momentum, trend, or market dynamics. Knowing the purpose of each can help a trader select those signals appropriate for their strategy.
Some of the most popular types are trend, momentum, breakout, and reversal signals.
Trend Signals
Trend signals try to determine whether the price movement is following the existing trend. Two popular forms of such signals are moving-average crossovers and trend-following systems.
They can work efficiently in cases where there is a well-developed trend in the market; however, they might generate frequent buy-sell situations in the case of sideways movement.
Momentum Signals
Momentum indicators concentrate on the intensity or velocity of price movements. Some of the common momentum indicators used include RSI and MACD.
While momentum figures can help give an indication of something that is going on, a very high momentum figure does not necessarily mean that there must be a reversal.
Breakout Signals
Breakout signals occur when there is movement outside of the price action range or level.
It is important to note that the breakout will determine how good it is. A quick move above the resistance level followed immediately by movement back into the range may signal a failed breakout.
Reversal Signals
Reversal indicators are designed to spot possible changes in trend. They can make use of divergence, chart patterns, momentum indicators, or structural changes in the market.
Due to the uncertainty involved in spotting reversals, it is often useful to wait for more confirmation before jumping into a trade.
Popular Overlays for Reading Price Charts
Different overlays have different uses, like recognizing a trend, measuring volatility, or recognizing significant price levels. The selection of an overlay will depend upon the trader’s approach to trading as well as the type of market information required.
Moving Averages
Moving averages help minimize noise and also give a baseline for analysis of trends. Short-term moving averages are fast-reacting, and long-term moving averages give a bigger picture.
VWAP
VWAP, or Volume Weighted Average Price, takes into consideration both price and volume in determining the average price. It is especially popular in intraday analysis.
Bollinger Bands
A Bollinger Band is made up of the middle moving average as well as two outer bands, which react to market volatility. The trader has the opportunity to examine the market conditions without automatically treating every band contact as a trade.
Support and Resistance
These zones are used by traders to determine where price has historically found support and resistance. They may be especially helpful when trying to determine if a signal is at a significant level.
How to Combine Signals and Overlays Without Chart Clutter
A valuable table should not include all the tools available.
Rather, you should provide each element with a single function. Thus, an overlay can be used to find the general trend, while a signal will indicate the exact configuration. Volatility will allow assessing whether the present market situation is right for your strategy.
For instance:
Apply the moving average strategy to get the direction.
Identify the support or resistance level.
Look out for the defined price level.
Apply only one momentum/volume indicator if necessary.
Define the invalidation point prior to entering.
Establish the exit level independently of the entry level.
It will create a sensible process flow rather than an array of disconnected technical indicators.
When Signals and Overlays Give Conflicting Information
Conflicting information is common because it arises due to different indicators measuring different attributes of price behavior.
For instance:
- Trend versus Momentum: The price might be increasing but momentum declining.
- Breakout versus Volume: A breakout signal can emerge even without high volume.
- Trend versus Reversal: A reversal signal can arise despite an existing strong trend.
The point is not about developing a new indicator but about choosing a priority factor in accordance with certain rules.
How to Build a Simple Signals and Overlays Trading Setup
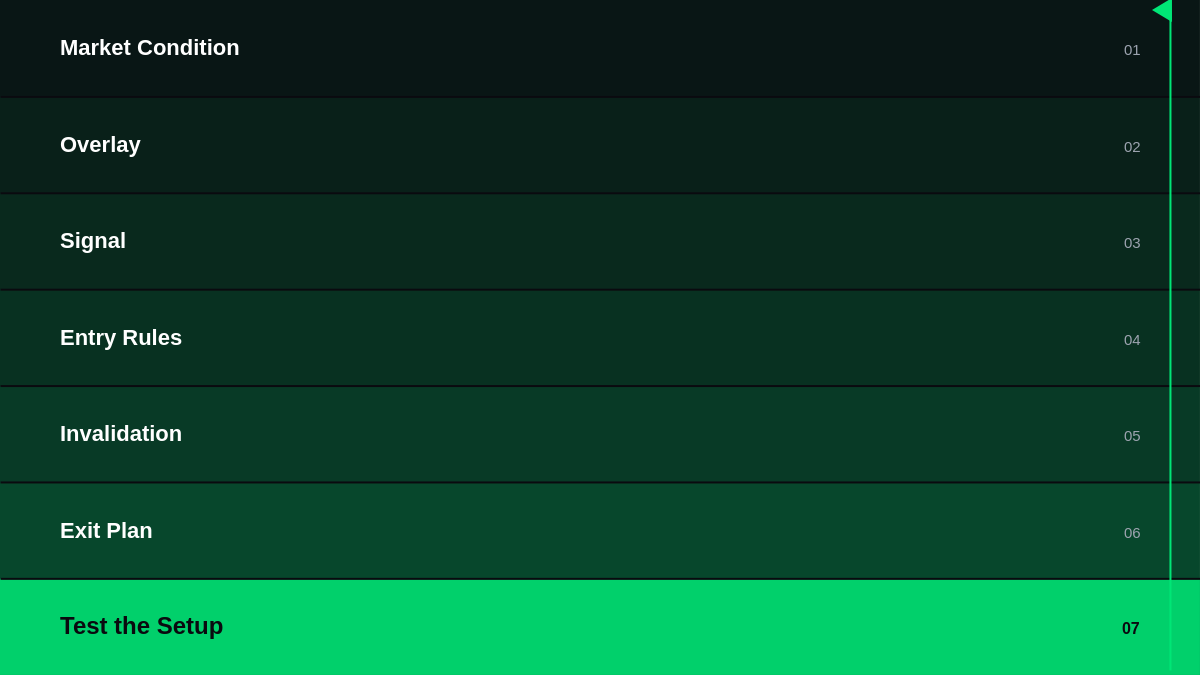
Follow these steps to create a simple and structured setup without overcrowding your chart.
Step 1: Define the Market Condition
Decide whether you want to trade trends, breakouts, reversals, or range-bound markets.
Step 2: Choose a Suitable Overlay
Select an overlay that supports your objective.
- Use a moving average for trend direction.
- Use support and resistance for key price levels.
- Use Bollinger Bands for volatility.
- Use VWAP for an intraday price reference.
Step 3: Define the Signal
Create a clear condition that tells you when a potential setup has appeared. This could be a breakout, crossover, momentum change, or specific price action pattern.
Step 4: Set the Entry Rules
Define exactly what must happen before entering a trade. For example:
- Price reaches a predefined support area.
- The required bullish or bearish condition occurs.
- The signal agrees with the broader market direction.
Step 5: Define Invalidation
Decide what price movement would prove the setup wrong. This gives the trade a clear risk boundary.
Step 6: Plan the Exit
Set the exit condition before opening the position. This could be a target, trailing condition, opposite signal, or important price level.
Step 7: Test the Setup
Test the complete set of rules across historical data and different market conditions. A setup should be clear enough to explain, test, and repeat.
Mistakes to Avoid When Using Signals and Overlays
Using signals and overlays effectively requires clear rules and disciplined chart selection. Avoiding common mistakes can help keep your analysis focused and prevent unnecessary confusion.
- Treating every signal as a trade
- Adding too many tools to the chart
- Ignoring current market conditions
- Changing rules after seeing the results
- Relying on visual simplicity instead of tested rules
- Using multiple tools that provide the same information
- Ignoring risk management when evaluating signals
Conclusion
Signals and overlays serve different purposes when it comes to technical analysis. With signals, predefined events may be determined, whereas overlays make it possible for traders to get an idea of the pricing environment in which these events take place. Signals and overlays combined can create a more systematic approach to interpreting the chart without using only one indicator.
The ideal setup for a strategy is not usually the one that includes the highest number of signals and visuals. It is better to select the minimum number of components, each with its own function, and then create clear rules to use in practice. This allows the trader to create an easily interpretable analysis process where every component on the chart has its meaning.
Frequently Asked Questions
1. What are signals and overlays?
Signals identify predefined market scenarios that might be worth paying attention to, while overlays show analytical data right on the price chart. Both elements can be combined to enhance market context and facilitate decision making.
2. Are signals better than overlays?
Neither is inherently better. Signals can be applied in order to diagnose particular situations, whereas overlays assist traders to see how prices relate to particular trends or levels.
3. Can overlays generate trading signals?
Yes. An overlay may become a part of a signal if certain conditions have been established regarding it. For instance, a moving average crossover can become a rule-based signal.
4. How many indicators should appear on a trading chart?
There are no rules regarding a universal number. Instead, one should consider using only those indicators that have a specific function in analysis. If there is an indicator that does not help in making the decision, its removal could help.
5. Do signals guarantee profitable trades?
No. They are derived from past or present market information and cannot be taken as a surety for any future result. Their effectiveness must be analyzed using definite criteria.