The RSI indicator (Relative Strength Index) is a momentum oscillator that measures the speed and size of recent price moves on a scale of 0 to 100, helping traders spot when an asset is overbought or oversold. Developed by J. Welles Wilder Jr. in 1978, it remains one of the most widely used tools in technical analysis, but reading it correctly takes more than memorizing "above 70, below 30."
This guide breaks down what RSI actually measures, how the calculation works, how to read its signals without falling into the common traps, and where it fits alongside modern, multi-factor tools like GainzAlgo V2 Alpha.
What is the RSI indicator?
RSI is a bounded oscillator, meaning its value always sits between 0 and 100, unlike price-based indicators that can run unbounded. It answers one specific question: out of recent price movement, how much of it was upward versus downward?
A high RSI reading (typically above 70) means recent gains have dominated, so the asset may be overbought. A low RSI reading (typically below 30) means recent losses have dominated, so the asset may be oversold. Everything in between is considered the neutral zone, where momentum doesn't clearly favor either side.
| RSI Value | Zone | What it suggests |
|---|---|---|
| 0 to 30 | Oversold | Selling pressure may be overextended; watch for a bounce |
| 30 to 50 | Weak/neutral | Momentum leans bearish but isn't extreme |
| 50 to 70 | Strong/Neutral | Momentum leans bullish but isn't extreme |
| 70 to 100 | Overbought | Buying pressure may be overextended; watch for a pullback |
How to read RSI signals
Overbought and oversold levels
The 70/30 thresholds are the default starting point, not a rigid rule. In a strong uptrend, RSI can hover above 70 for extended stretches without price reversing, so treating every overbought reading as an automatic sell signal is one of the most common mistakes newer traders make. The same applies in reverse during strong downtrends.
RSI divergence
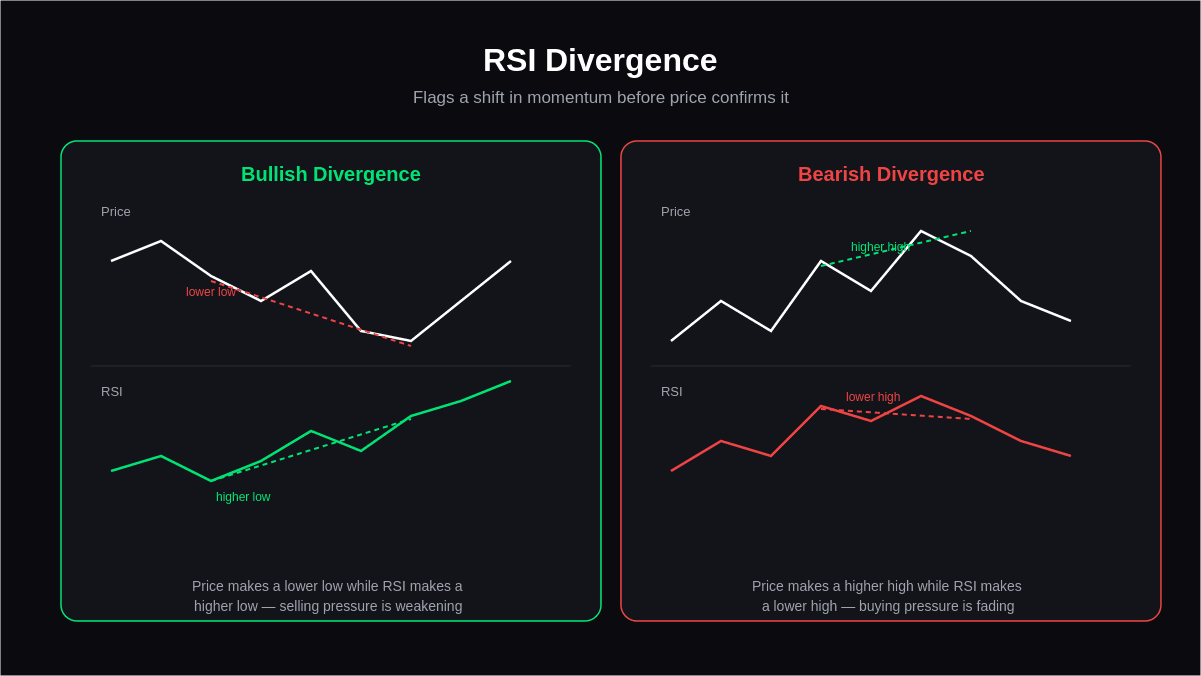
Divergence is arguably the most useful RSI signal, because it flags a shift in momentum before price confirms it.
- Bullish divergence: price makes a lower low, but RSI makes a higher low. This suggests the selling pressure behind the new low is weaker than the move before it.
- Bearish divergence: price makes a higher high, but RSI makes a lower high. This suggests buying pressure is fading even as price pushes higher.
Divergence doesn't mean "reverse now." It means momentum and price have disagreed, which is worth paying attention to alongside other confirmation.
Centerline crossovers
Some traders use the 50 level as a simpler trend filter: RSI crossing above 50 suggests momentum is turning bullish, while crossing below 50 suggests it's turning bearish. This is a less noisy signal than watching for 70/30 extremes.
Failure swings
Wilder's original concept: RSI moves into overbought/oversold, pulls back without price setting a new corresponding extreme, then breaks its prior swing point. It's a lesser-known but valid confirmation signal for reversals.
RSI settings and timeframes
The 14-period default works across most timeframes, but the setting is adjustable:
- Shorter periods (e.g., 7 to 9): more sensitive, more signals, more noise, often used by traders working faster setups similar to those covered in best indicators for scalping.
- Longer periods (e.g., 21 to 25): smoother, fewer false signals, but slower to react.
RSI also behaves differently depending on timeframe. A 1-minute chart RSI reading is far noisier than a daily chart RSI reading, so the same numeric level can mean different things depending on context.
RSI vs. other momentum tools
| Indicator | What it measures | Best used for |
|---|---|---|
| RSI | Ratio of average gains to average losses | Spotting overbought/oversold and divergence |
| MACD | Relationship between two moving averages | Confirming trend direction and momentum shifts |
| Stochastic | Closing price relative to its recent range | Faster, more sensitive momentum reads |
None of these tools is "better" in isolation. They measure momentum from different angles, which is exactly why relying on a single indicator creates blind spots.
Common RSI mistakes to avoid
- Trading overbought/oversold in isolation during a strong trend, without checking the broader structure.
- Ignoring divergence context: a divergence in a choppy, range-bound market carries far less weight than one at a clear support or resistance level.
- Using default settings on every timeframe without adjusting for how noisy or smooth that timeframe actually is.
- Treating RSI as a standalone system rather than one input among several.
Where RSI fits into a modern trading approach
RSI was built in 1978, for markets that looked nothing like today's: no algorithmic order flow, no 24/7 crypto volatility, none of the participant volume seen now. That doesn't make it obsolete, but it does mean single-indicator analysis often produces conflicting reads: RSI says overbought, a moving average says neutral, MACD hints at more upside. This is exactly the gap that next-gen trading indicators were built to close, by weighing multiple factors across timeframes instead of relying on one formula from 1978 in isolation.
This is where the GainzAlgo Intelligence Terminal is built for exactly this problem. Rather than showing an isolated RSI reading, GainzAlgo V2 Alpha combines momentum, trend, and volatility factors into a single non-repainting signal, with built-in TP and SL levels, cutting through the guesswork of reconciling multiple indicators manually. You can see the pricing plans or explore the free position-sizing calculators to plan risk around any RSI-based setup.
RSI limitations
RSI is a lagging-leaning tool. It's calculated from past price action, so it reacts to momentum rather than predicting it outright. In strongly trending markets, it can generate false reversal signals well before an actual top or bottom forms. It works best as one confirmation layer, not a complete trading system on its own.
Frequently asked questions
What does RSI mean in trading?
RSI (Relative Strength Index) is a momentum oscillator, scored 0 to 100, that shows whether recent price gains or losses have dominated over a set period, typically used to flag overbought or oversold conditions.
What is a good RSI value to buy?
There's no single "correct" number. Many traders watch for RSI moving out of oversold territory (below 30) as a potential buy signal, but it's stronger when combined with support levels, trend direction, or bullish divergence rather than used alone.
What is RSI divergence?
RSI divergence happens when price and RSI move in opposite directions. For example, price sets a new low while RSI sets a higher low (bullish divergence), suggesting the move's underlying momentum is weakening.
What is the best RSI setting?
14 periods is the standard default and works well across most timeframes. Shorter settings (7 to 9) increase sensitivity and signal frequency; longer settings (21 to 25) smooth out noise but react more slowly.
Is RSI reliable on its own?
RSI is most reliable when paired with other confirmation, such as trend structure, support/resistance, or volume, rather than used as a standalone signal, since it can stay overbought or oversold for extended periods during strong trends.