While more than one trading position is open simultaneously, analyzing each position separately might be misleading. The concept of portfolio correlation allows traders to measure the extent to which different securities or trading strategies interact. Two positions could be diverse in terms of the securities being used, but deliver the same performance under changing market conditions.
Portfolio correlation could thus enable traders to decide whether there are distinct positions in their portfolio or just multiple instances of one particular trade. Additionally, this concept can be used in strategy selection and analysis of the historical performance of positions and strategies.
The purpose of this guide is to give an understanding of the meaning of portfolio correlation, ways of its calculation, interpretation of correlation coefficients, and usage of this concept by traders when managing their portfolios.
What Is Portfolio Correlation?
Portfolio correlation refers to the correlation of the returns of the assets, trading approaches, or position within the same portfolio.
In case two assets often tend to move in the same direction, they will be positively correlated. When one asset rises in price and the other tends to fall in price, the two assets will be negatively correlated. However, where there is no clear relationship, the correlation will approach zero.
For instance, a trader may have positions in two distinct tech stocks. Even though the firms are different assets, the movements of their prices can be affected by similar expectations regarding interest rates, industry sentiments, or the performance of the market overall. Owning two assets does not necessarily mean diversification.
Correlation is thus a measure of how two assets move in relation to each other.
Why Portfolio Correlation Matters
The number of positions in a portfolio does not necessarily indicate how diversified it is.
Consider two hypothetical portfolios:
| Portfolio | Holdings | Typical Relationship |
|---|---|---|
| A | 5 technology stocks | Often move in a similar direction |
| B | 5 assets from different market exposures | Lower relationship between some holdings |
In portfolio A, there are five different investments, but any big move in the tech industry will impact a lot of the investments at once. Portfolio B might not be similar among its different investments and will therefore offer more diversity.
This is the reason why traders shouldn’t judge diversification only by counting the number of different investments.
Correlation can assist traders in answering some of the following questions:
- Do different investments react in the same way to a particular market movement?
- Are different trading techniques getting the same results?
- Does including an additional investment add real diversification to the portfolio?
- Do seemingly independent transactions show similar behavior?
- How do the relationships between different investments change over time?
The answers can provide a more complete view of portfolio construction.
How Asset Correlation Works
Asset correlation refers to the extent of association between the movements in returns of two different assets.
The correlation is mostly illustrated on a scale of -1 to +1:
| Correlation | General Interpretation |
|---|---|
| +1.00 | Perfect positive relationship |
| +0.50 | Moderate positive relationship |
| 0.00 | Little or no linear relationship |
| -0.50 | Moderate negative relationship |
| -1.00 | Perfect negative relationship |
A value close to +1 suggests that the assets have traditionally shown movement in tandem with each other. A value close to -1 shows that they have generally shown inverse movements.
Correlation does not necessarily imply permanence of the relationship.
Market associations may shift due to changes in economic environment, volatility, liquidity, and investor behavior.
How to Calculate a Correlation Coefficient
The correlation coefficient is widely employed as a measure of the relationship between two series of returns.
A widely employed measure of correlation is Pearson correlation:
r=σXσYCov(X,Y)
Where:
- r = correlation coefficient
- Cov(X,Y) = covariance between the two return series
- σX = standard deviation of the first return series
- σY = standard deviation of the second return series
When applying this measure in practical analysis, traders usually do not have to compute it on their own. Spreadsheets and statistical software are able to calculate the correlations based on return data.
What matters is the fact that the measure uses returns and not just the levels of prices themselves since the two assets may have different prices but have a high correlation.
How to Read a Portfolio Correlation Matrix
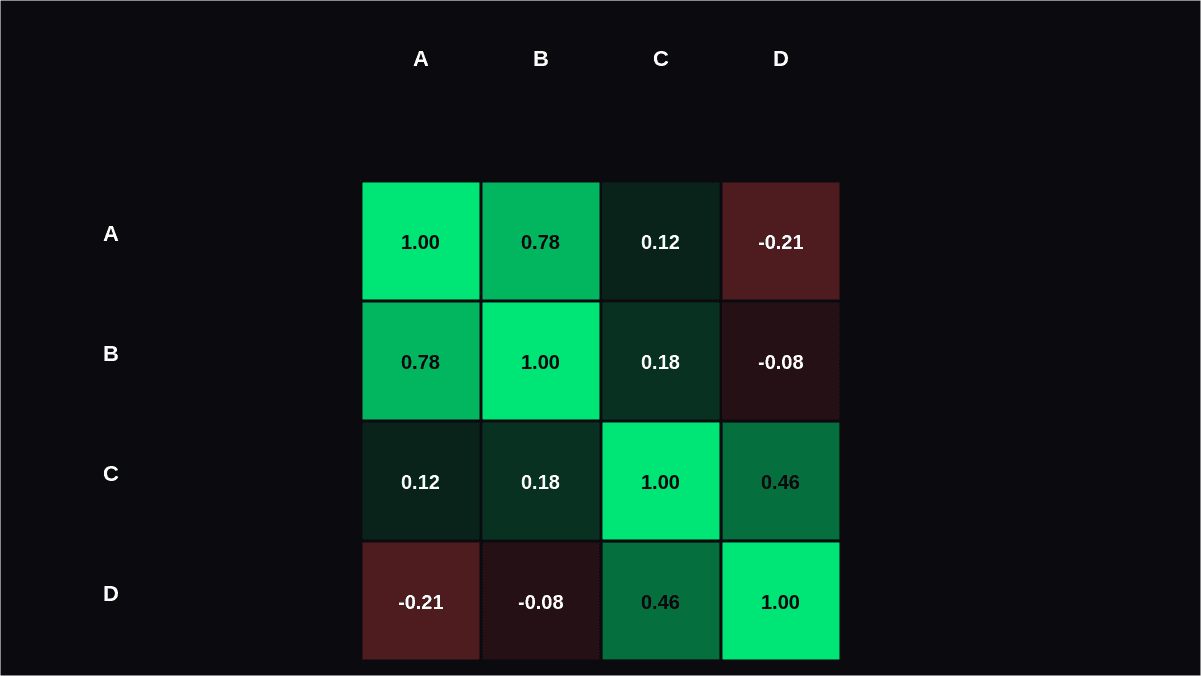
When multiple assets or approaches are to be analyzed collectively, traders can consider a correlation matrix.
One such matrix would appear in the following form:
| Asset Category | Asset A | Asset B | Asset C | Asset D |
|---|---|---|---|---|
| Asset A | 1.00 | 0.78 | 0.12 | -0.21 |
| Asset B | 0.78 | 1.00 | 0.18 | -0.08 |
| Asset C | 0.12 | 0.18 | 1.00 | 0.46 |
| Asset D | -0.21 | -0.08 | 0.46 | 1.00 |
The diagonal will always be equal to 1.00 since every single asset will always have a perfect correlation with itself.
However, the more interesting data can be seen in the rest of the cells.
For example, there is a correlation between Asset A and Asset B which is equal to 0.78 – which is rather strong historically.
There is an inverse correlation between Asset A and Asset D which equals -0.21.
Hence, a correlation matrix can show some of the relationships that would not be seen on individual charts.
Portfolio Correlation vs. Diversification
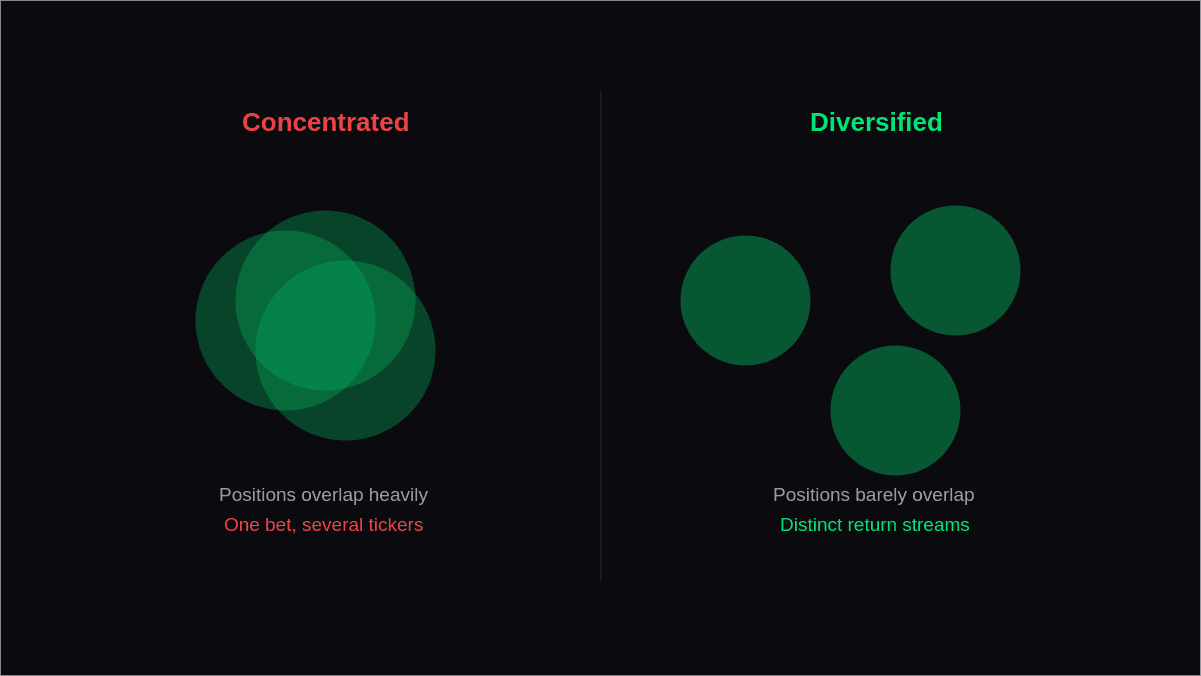
Portfolio diversification is more comprehensive than correlation.
Diversification entails diversifying exposure to investments based on assets, markets, strategies, sectors, time frames, or other significant factors. Correlation is just one factor that can help decide if the various investments in question indeed exhibit differences.
For instance, holding:
- Three stocks from the same industry
- Three highly correlated technology ETFs
- Several strategies that all trade the same market direction
May not result in much diversification despite the various holdings.
By contrast, positions that generate diverse returns may give more diversification to the portfolio.
Nevertheless, just because two investments have little correlation does not automatically imply that the second investment is worthy of holding. The trader must still evaluate the asset in terms of its trading strategy, liquidity, cost, past performance, and suitability in the overall portfolio.
Correlation Between Trading Strategies
Correlation, however, is not restricted only to individual stocks.
It can also be considered for trading systems.
Let's take an example.
A trader has three trading systems.
- Strategy A follows equity momentum.
- Strategy B trades short-term currency reversals.
- Strategy C follows a trend-following approach in commodities.
The comparison of these three systems’ return histories would help understand whether there is a correlation between the time the strategies make money and the time they make losses.
This is especially helpful when assessing portfolios of trading strategies. The two strategies can be totally different from each other in terms of entries, but their equity curves can be very well correlated due to similar market conditions.
On the other hand, the two strategies trading the same asset may have quite different return histories because of the difference in logic, timeframes, and market conditions of the trades.
What High and Low Correlation Can Tell Traders
A high correlation implies that different positions have exposure to the same market risks.
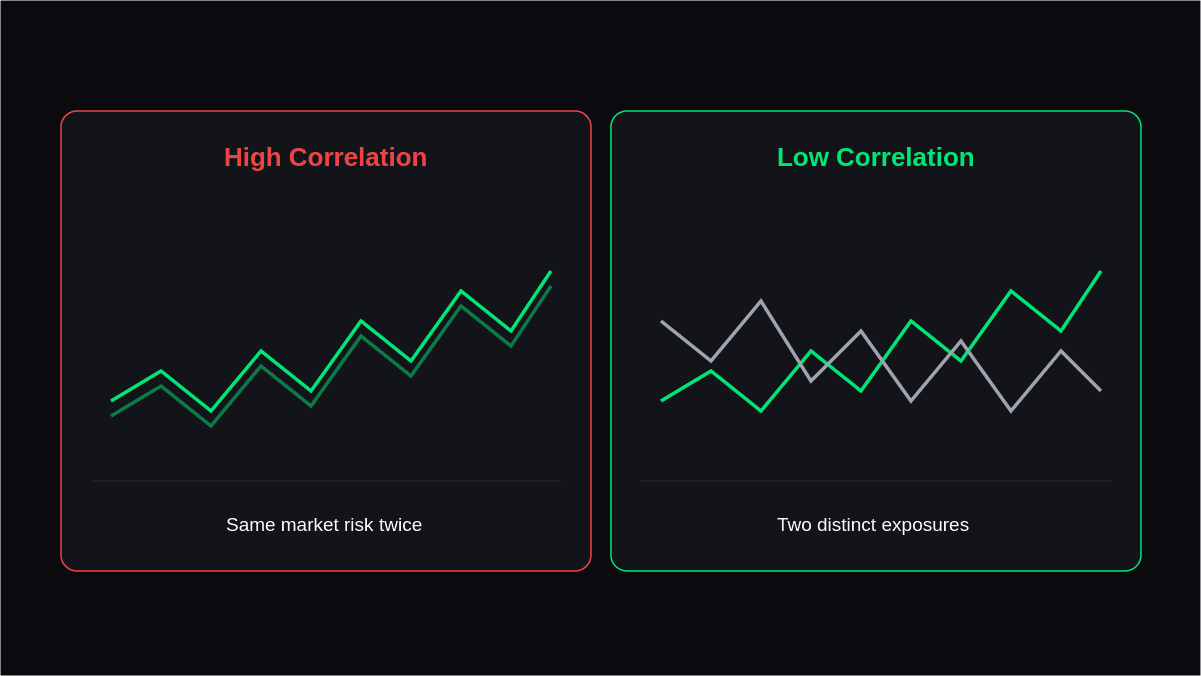
If multiple positions are moving together all the time, then a trader might be making only one market bet using different tools.
A low correlation implies that the return behavior of two positions has not been historically very dependent.
However, correlation levels are not always good or bad on their own.
A high correlation may have been planned by a trader. For instance, if the strategy relies on a particular sector, then related instruments may be used.
In turn, a low correlation does not mean that there will be no losses. Correlation refers to historical relationships rather than to the future performance of assets in the next market event.
The objective is not to reduce all correlations, but to utilize the information provided by them.
Common Mistakes When Using Correlation
Correlation can provide useful insight into how assets or strategies behave together. However, several common mistakes can lead to misleading conclusions when interpreting correlation data.
- Assuming correlation is permanent
- Measuring only a short period
- Confusing correlation with causation
- Looking only at asset names
- Treating zero correlation as guaranteed diversification
- Ignoring changing market conditions
Step by Step Guide: How to Use Correlation in Portfolio Reviews
Using correlation as part of a structured review process can help traders better understand how different assets and strategies behave together.
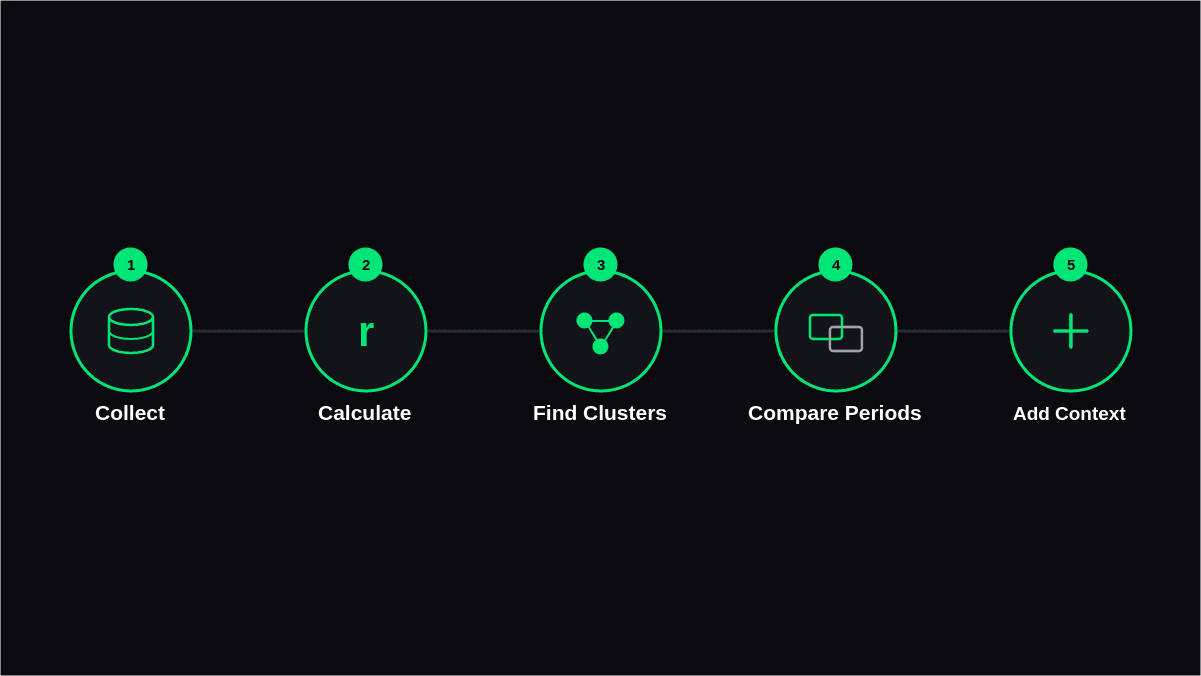
Step 1: Collect historical return data
Collect similar historical return data for the assets or investment strategies you wish to analyze.
Step 2: Calculate the correlation
Compute the correlation coefficient between the chosen asset or strategies for a certain period of time. Examine the outputted correlation matrix and note down any important relationships.
Step 3: Identify highly correlated positions
Find clusters of positions that exhibit high correlations.
For instance, if five strategies are exhibiting similar return behavior and the sixth strategy exhibits the same correlation behavior, adding the sixth one will have little diversification effect.
Step 4: Compare correlation across different periods
Analyze how correlations evolve across various periods and economic situations.
An investment strategy may be independent when the market is calm but exhibit higher correlation with other investment strategies when the market is volatile.
Step 5: Consider correlation alongside other factors
Do not solely depend on correlation for your decision-making process. Instead, consider it along with other factors.
Limitations of Portfolio Correlation
Portfolio correlation can provide useful historical insight into how assets or strategies have behaved together. However, it should be interpreted carefully because correlation has several limitations.
- Based on historical data
- Does not prove causation
- Can change across market conditions
- May hide short-term relationship changes
- Does not measure strategy profitability
- Does not guarantee future diversification
- Should not be used as the only portfolio analysis measure
Final Thoughts
Portfolio correlation offers traders a real tool for assessing how various assets and approaches are related within a portfolio. It allows looking not at the mere number of positions held by the trader but rather their ability to generate various return streams.
Correlation may uncover unexpected similarities between the positions, offer traders another instrument to compare trading approaches, and add additional information when analyzing portfolio construction. Still, it needs to be remembered that correlation is a purely historical measure.
The best way would be to apply it in combination with knowledge of assets/trading approaches, market environment, and the role of particular positions within the portfolio.
FAQs
1. What is portfolio correlation?
Portfolio correlation refers to how related the returns on different assets or trading strategies are. This is used by traders to determine whether their trades are similar, unrelated, or even opposites in terms of past returns.
2. What does a correlation of +1 mean?
A +1 portfolio correlation means that there is a perfect positive correlation. Historical information shows that both of the return series are moving in the same direction and proportionally.
3. Is low correlation always better for a portfolio?
No. Low portfolio correlation provides diversified returns but it doesn’t mean that the asset is appropriate for the portfolio. There are other factors like the strategy of the asset, liquidity, cost, and past performance that the trader must take into consideration.
4. Can correlation between assets change?
Yes. Correlation can vary due to changes in market dynamics and conditions. If a certain correlation is noticed in one period, it will not necessarily be the case for other periods.
5. Can correlation be used to compare trading strategies?
Yes. Investors can look at past returns or equity curves of various strategies in order to figure out if they deliver more-or-less equal performance. This way, one can find strategies which deliver really different portfolio exposure.