A pivot points indicator calculates predefined price levels based on the high, low, and closing prices of the previous trading session. Traders use these levels to identify potential support and resistance areas, chart analysis, and trade setups.
The classical pivot points system determines one pivot point level (Pivot Point, PP), three resistance levels (R1, R2, and R3), and three support levels (S1, S2, and S3).
This guide explains the indicator from calculation to its practical application which includes the selection of the pivot calculation technique, creating rules based on the levels, and combining pivots with other analysis. We also discuss how you can avoid these common testing mistakes.
What Is a Pivot Points Indicator?
A pivot point indicator is a technical analysis tool that identifies predefined price levels for a trading period.
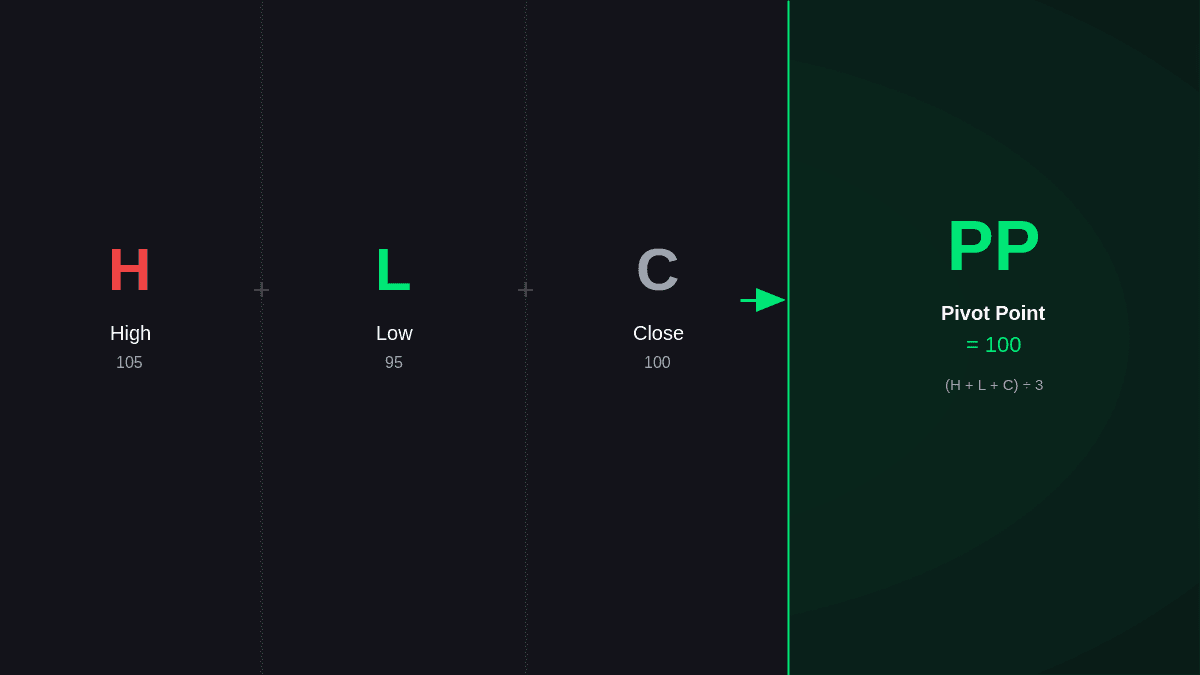
The Standard pivot points calculation uses three values from the previous session:
- High (H)
- Low (L)
- Close (C)
These values produce seven standard levels:
- Pivot Point (PP)
- Resistance 1 (R1)
- Resistance 2 (R2)
- Resistance 3 (R3)
- Support 1 (S1)
- Support 2 (S2)
- Support 3 (S3)
Unlike a moving average, classic pivot point values usually remain fixed during the selected trading period because they are calculated from completed price data.
How Does the Pivot Points Indicator Work?
The Pivot Points Indicator calculates levels for an upcoming period using completed price information.
For daily calculations, the previous session's high, low, and close are used to determine the levels for the upcoming session.
| Pivot Level | Description |
|---|---|
| PP | Central pivot point and primary reference |
| R1 | First resistance reference above PP |
| R2 | Second resistance reference above PP |
| R3 | Third resistance reference above PP |
| S1 | First support reference below PP |
| S2 | Second support reference below PP |
| S3 | Third support reference below PP |
PP is the central reference. Continuous trading above PP can indicate bullish conditions, while continuous trading below PP can indicate bearish conditions. Trading around PP may suggest a more balanced market.
R1, R2, and R3 provide progressively higher resistance references. R1 is generally the first resistance level encountered during an upward move, while R2 and R3 become relevant if price continues higher.
S1, S2, and S3 provide progressively lower support references. S1 is generally the first support level encountered during a downward move, while S2 and S3 become relevant if price continues lower.
The distance between these levels depends on the previous session's price range and the calculation method used.
How to Calculate Pivot Points
Knowing how to calculate pivot points helps with chart analysis and backtesting.
Calculate the Pivot Point
Collect the previous session's data:
- Previous High = H
- Previous Low = L
- Previous Close = C
The Standard formula is:
PP = (H + L + C) / 3
Calculate Resistance Levels
R1 = (2 × PP) − L
R2 = PP + (H − L)
R3 = H + 2 × (PP − L)
Calculate Support Levels
S1 = (2 × PP) − H
S2 = PP − (H − L)
S3 = L − 2 × (H − PP)
Pivot Point Calculation Example
Assume the previous session had:
- High = 105
- Low = 95
- Close = 100
First:
PP = (105 + 95 + 100) / 3 = 100
Then:
R1 = (2 × 100) − 95 = 105
S1 = (2 × 100) − 105 = 95
The remaining levels can be calculated using their respective formulas.
Why Session Data Matters
The calculation depends on the accuracy of the data used. Two platforms can produce different pivot levels because of differences in:
- Session times
- Time zones
- Data providers
- Market definitions
While backtesting, make sure that your settings remain constant. This is because any change in data can alter the levels as well.
Daily vs. Weekly vs. Monthly Pivot Points
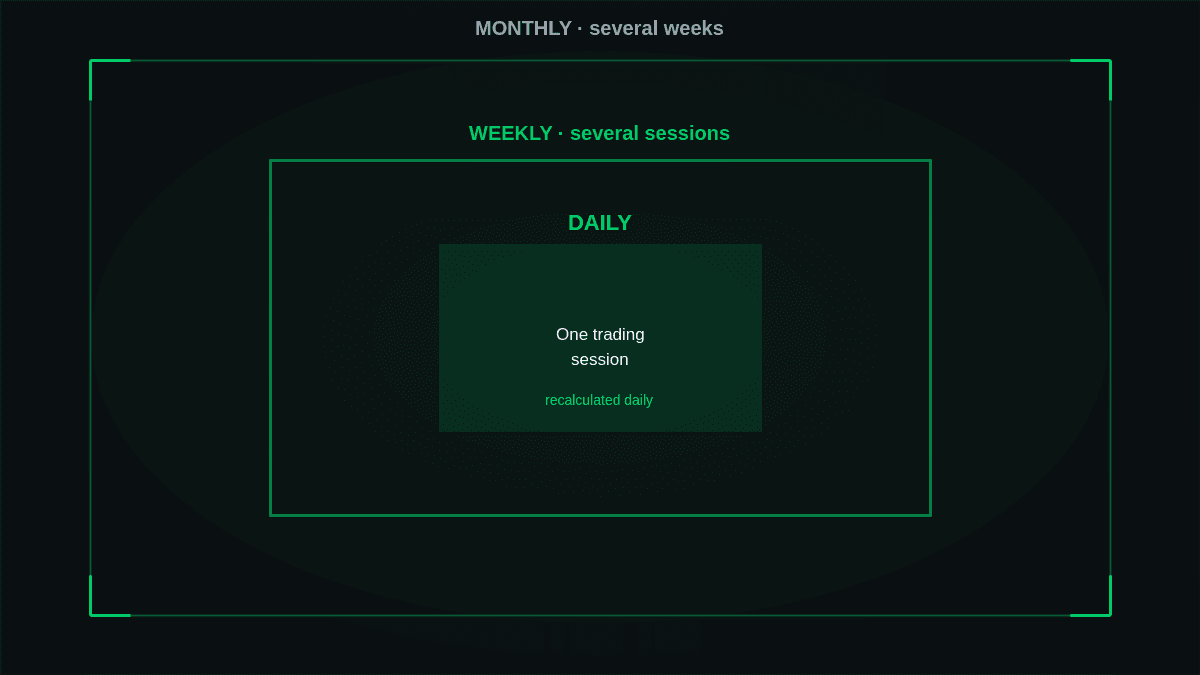
The calculation of pivots can be made using different time intervals. This affects how fast levels change and how much of the market's history is incorporated into them.
| Pivot Period | Common Use | Reference Horizon |
|---|---|---|
| Daily | Day trading | One trading session |
| Weekly | Swing trading | Several sessions |
| Monthly | Longer-term analysis | Several weeks |
Daily Pivot Points
Daily pivots are recalculated for every trading session. Traders usually use these for intraday trading analysis.
Weekly Pivot Points
Weekly pivot points remain relevant across multiple sessions and can provide broader references for swing trading.
Monthly Pivot Points
Monthly pivots provide a longer-term reference for broader price movements rather than short-term intraday fluctuations.
Using several timeframes can provide additional context. However, overlapping levels can make the chart harder to read, so each timeframe should have a clear purpose.
Types of Pivot Points
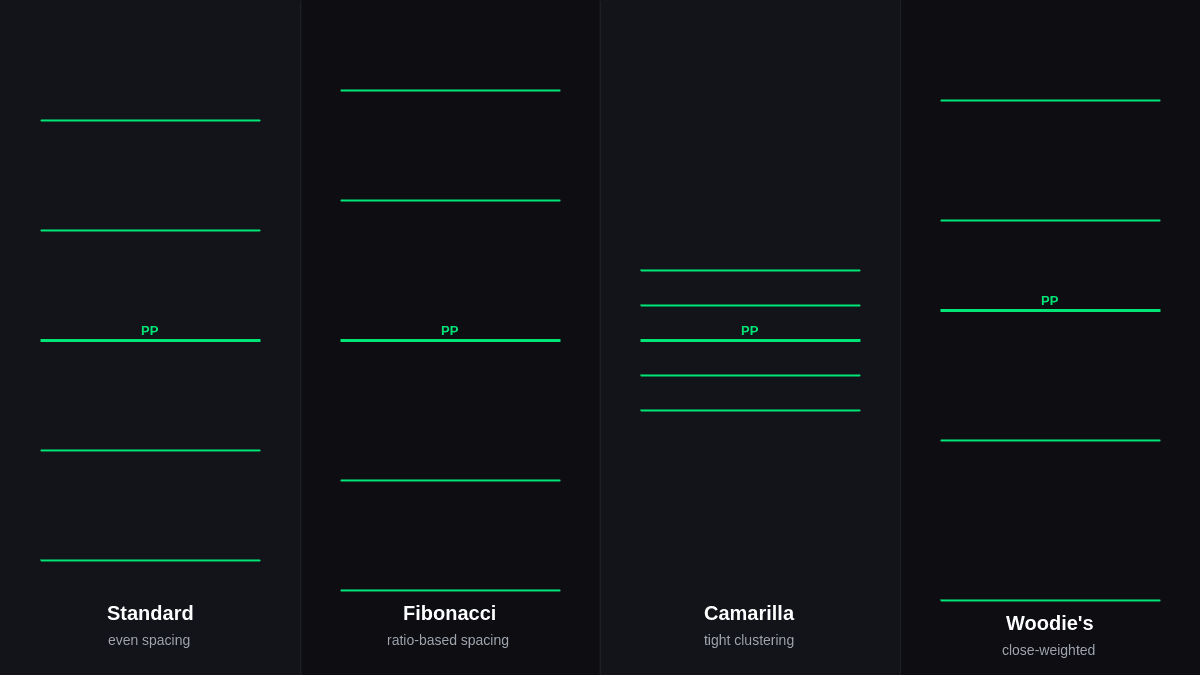
Traders can use several pivot calculation methods. Their formulas determine how the resulting levels are positioned around the central pivot.
| Pivot Type | Main Difference | Common Application |
|---|---|---|
| Standard | Traditional H/L/C calculation | General trading analysis |
| Fibonacci | Uses Fibonacci ratios for level distances | Fibonacci-based systems |
| Camarilla | Creates relatively tight levels | Intraday range strategies |
| Woodie's | Places greater emphasis on closing data | Close-sensitive approaches |
Standard Pivot Points
Standard pivot points use the high, low, and close values of the previous session. They are a straightforward starting point because the calculation is easy to understand.
Fibonacci Pivot Points
Fibonacci pivot points use Fibonacci ratios to determine the spacing of pivot levels relative to the central pivot. They may be useful for traders who already use Fibonacci relationships in their trading systems.
Camarilla Pivot Points
Camarilla pivot points tend to produce levels closer to the central pivot than Standard pivot points. They are commonly linked with intraday range-based systems.
Woodie's Pivot Points
Woodie's pivot points use a different weighting method that places greater emphasis on the closing price. This sets them apart from the conventional Standard method.
There is no objectively perfect pivot type for every market. Standard is a practical starting point, while Fibonacci, Camarilla, and Woodie's methods may suit specific trading systems. Test the method under the market conditions and time period you actually trade.
How to Build a Pivot Point Trading Strategy
A pivot point trading strategy is more effective when decisions are defined before the trade develops.
Step 1: Define the Market Environment
Determine whether you are trading an:
- Uptrend
- Downtrend
- Range
- High-volatility market
The same price level can behave differently in trending and sideways markets.
Step 2: Choose the Setup Type
Define the type of price action your strategy targets:
- Bounce: Price touches the level and rejects it.
- Breakout: Price moves through the level and meets continuation requirements.
- Failed breakout: Price moves through the level and then returns below or above it.
Do not switch between setups based on the outcome of a trade.
Step 3: Establish Confirmation Rules
Define what additional information is required before entering a trade.
Confirmation criteria may include:
- Candlestick structure
- Volume
- Momentum
- Market structure
- Higher-timeframe levels
- Volume profile
Each criterion should have a defined purpose.
Step 4: Define Entry Conditions
Organize the strategy around measurable criteria.
For example, breakout criteria may include:
- Price touches R1.
- The candle closes above R1.
- Volume is above a specified level.
- Price retests R1.
- The retest is confirmed.
- A predefined trigger produces the entry.
These conditions should come from the tested system rather than being changed after seeing the result.
Step 5: Define the Invalidation Point
Identify the price level at which the initial trade thesis becomes invalid. This provides a logical basis for stop placement.
Step 6: Establish the Target
Possible targets include:
- Next pivot level
- Previous swing high or low
- Another established technical level
- A predefined reward-to-risk threshold
The target should follow the tested strategy rather than being chosen because a level looks attractive on the chart.
Step 7: Calculate Position Size
Consider:
- Maximum acceptable loss
- Entry price
- Stop distance
- Account risk rules
A stronger-looking setup does not automatically justify a larger position.
Step 8: Backtest and Record Results
Document each trade using:
- Market
- Pivot method
- Pivot period
- Market condition
- Setup
- Entry
- Stop
- Target
- Confirmation
- Outcome
Analyze the results across a sufficiently large sample rather than judging the strategy from a few trades.
Practical Example
Suppose an intraday chart has:
- PP = 100
- R1 = 105
- R2 = 110
- S1 = 95
If price reaches R1, the trading decision depends on the predefined setup. A rejection may qualify as a bounce, while a confirmed move and retest may qualify as a breakout. A move above R1 followed by a return below it may meet the criteria for a failed breakout.
This shows how the same pivot level can be used with different predefined rules.
If you want to automate predefined conditions, automated trading signals can help monitor rule-based setups while reducing the need for constant manual chart watching.
Pivot Points vs. Moving Averages
Pivot points and moving averages provide different types of chart information.
| Feature | Pivot Points | Moving Averages |
|---|---|---|
| Input | Previous session data | Historical price series |
| Primary role | Fixed price references | Trend smoothing |
| Update behavior | Usually fixed for the selected period | Changes as new data enters |
| Typical use | Potential reaction areas | Trend direction and momentum context |
| Calculation horizon | Defined session or period | Selected averaging length |
A trader can use both for different purposes. For instance, a moving average can help identify the larger trend, while a pivot level can provide the price region where the trade condition is evaluated.
Advanced Pivot Point Strategies
After choosing the initial strategy, additional information can be used to refine selectivity.
Multi-Timeframe Confluence
Confluence occurs when independent technical references cluster around a similar price.
For example, if daily R1 and a weekly pivot level are close to each other, that area may deserve additional attention. Confluence should support the trade criteria rather than replace them.
Previous High and Low Confluence
Previous-day highs and lows provide additional context when they are close to calculated pivot levels. When R1 is close to the previous high, traders can monitor how price behaves around the combined area.
Pivot Points With Volume Profile
Pivot points identify calculated price levels, while volume profile shows where trading activity has accumulated across price levels. Price action then shows how the market reacts around those areas.
Using tools with different functions can provide more structured analysis than adding multiple indicators that provide similar information.
Systematizing Pivot-Based Rules
Use measurable factors instead of subjective terms.
Instead of:
"Enter trade at the strong breakout of R1."
Define what a strong breakout means using factors such as:
- Closing price compared to R1
- Minimum candle range
- Required volume
- Re-test rule
- Entry timing
Precise conditions make a strategy easier to reproduce and test.
Common Pivot Point Trading Mistakes
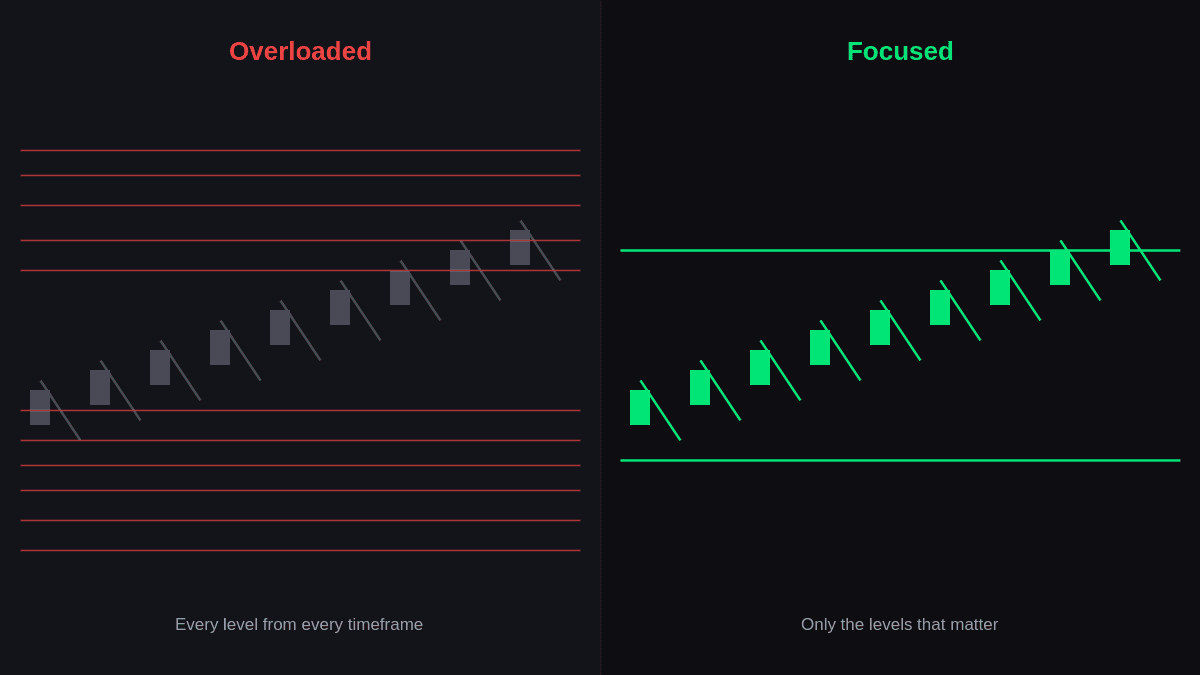
Some common mistakes many traders make while using pivot point indicators.
1. Trading Every Level
It is not necessary to trade all calculated levels. Trade only those that satisfy your setup criteria.
2. Overloading the Chart
Multiple pivot setups and timeframes can create too many levels, making important areas harder to identify.
3. Changing Rules After Backtesting
Repeatedly changing parameters to improve historical performance can result in an overfitted strategy.
4. Mixing Session Definitions
Changing session criteria between tests affects the pivot calculation and makes results difficult to compare.
5. Ignoring Market Regime
A strategy that performs well when prices are trending in one direction may perform differently in another market condition.
6. Treating Confluence as a Trade Trigger
Confluence can add context to a setup, but it should not replace the actual trade signals.
Final Takeaway
The pivot points indicator provides predefined price references based on historical data. Its effectiveness depends on the selected timeframe, calculation method, market conditions, confirmation rules, and risk management.
For a practical approach, use a consistent calculation method, keep session parameters stable, create one or two precise setups, and backtest the complete rule set.
FAQs
How are pivot points calculated from previous-day data?
Standard daily pivots use the previous session's high, low, and close. These three values are used to calculate PP, followed by the resistance and support levels.
What does PP mean in pivot points?
PP stands for Pivot Point. It's the central level in the Standard pivot system and is calculated from the previous session's high, low, and close.
What do R1, R2, and R3 mean in pivot points?
R1, R2, and R3 are the first, second, and third resistance levels above PP. They're calculated using the Standard pivot formulas and represent progressively higher price references.
Can you use pivot points without other indicators?
Yes. Pivot points can be analyzed using price action alone. Whether additional indicators improve a strategy depends on what information the system needs and whether testing shows a meaningful benefit.
Why do pivot levels differ between trading platforms?
Differences can result from session definitions, time zones, market data, or calculation settings. If the underlying high, low, or close differs, the resulting pivot levels can differ as well.