A trading strategy could be great in backtesting and yet perform poorly when tested against new market environments. Overfitting trading strategy design is therefore one of the major obstacles for anyone who designs, optimizes, or evaluates an automated trading system.
Overfitting occurs where the strategy is too well tuned to the historical data. In trying to find characteristics of the markets that would hold in the future, the strategy starts tuning into the noise in the past data or any other anomalies.
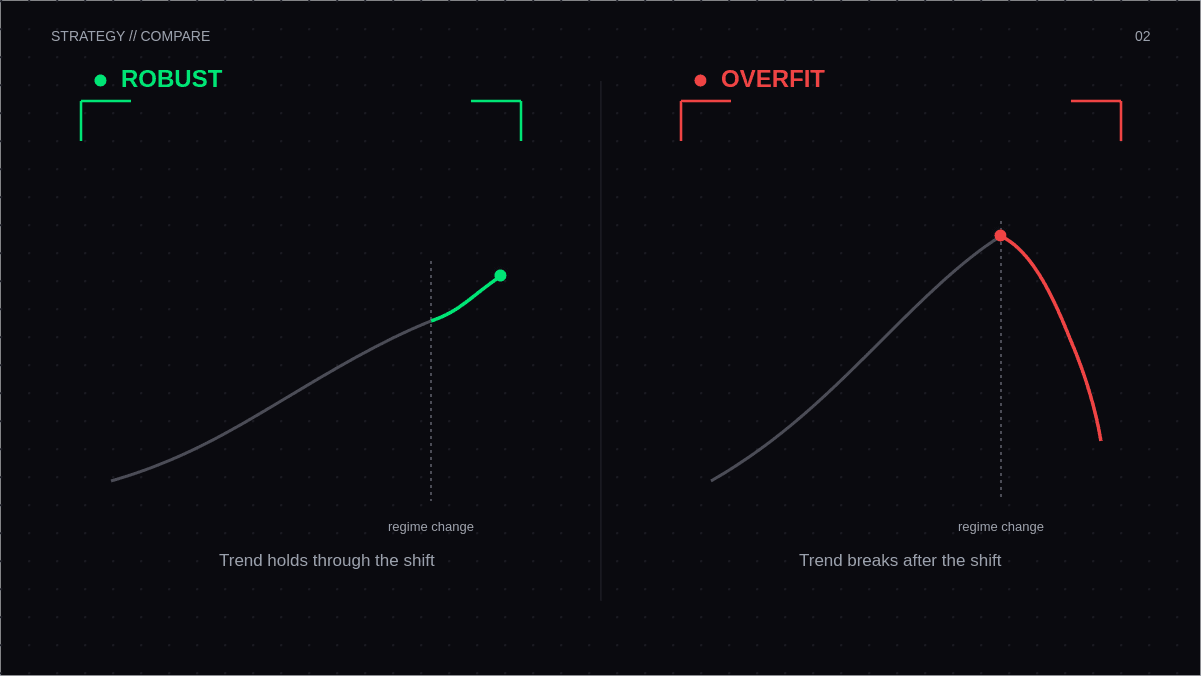
An effective strategy will not require the market to behave in the way it was while developing the strategy. This means that the strategy should withstand changes in volatility, trending environment, transaction costs, and market structure.
In this guide, you’ll learn what trading strategy overfitting looks like, why backtesting overfitting happens, which warning signs to watch for, and how to validate a strategy using out-of-sample testing, walk-forward testing, stress testing, and realistic trading costs. You’ll also find a practical checklist you can use before considering a strategy ready for forward or live testing.
What Is Trading Strategy Overfitting?
The problem of trading strategy overfitting arises when a model is fitted to historical data so closely that its results depend on the exact dataset used rather than on a genuine trading relationship.
For instance, assume that a strategy starts with a moving average crossover.
During the development process, a trader tries different combinations of:
- Moving average periods
- Stop-loss levels
- Profit targets
- Entry filters
- Trading hours
- Volatility filters
- Position-sizing rules
Eventually, the system finds a combination that produces extremely high historical returns.
This can look impressive, but it may be deceiving.
The important question is not simply, “How well did this strategy perform historically?” It is, “How much of that performance is likely to survive when the market behaves differently?”
A useful distinction is:
| Robust Strategy | Overfit Strategy |
|---|---|
| Captures broader market behavior | Captures historical noise |
| Uses relatively simple rules | Uses excessive conditions |
| Performs reasonably across periods | Depends heavily on one period |
| Tolerates parameter changes | Breaks after small changes |
| Works on unseen data | Performs mainly on development data |
| Survives realistic costs | Often depends on idealized execution |
The objective is not to eliminate every losing period. It is to determine whether the strategy has characteristics that are likely to remain useful beyond the data used to build it. Trading strategy benchmarks can help put these results into context by comparing performance, risk, and consistency against relevant standards.
Why Does Overfitting Happen?
Generally, overfitting develops gradually rather than from a single mistake.
Excessive Parameter Optimization
Each additional parameter creates another opportunity to improve past performance.
When a model uses a fast moving average, slow moving average, stop-loss, profit target, volatility filter, trading-hour restriction, and several entry criteria, there can be thousands of possible combinations.
Testing enough combinations increases the probability of finding one that performed well simply by chance.
Optimization itself is not the problem. The risk appears when optimization becomes a repeated search for the best historical result.
Too Many Rules
Complexity can make a strategy difficult to evaluate.
If a system depends on a long list of conditions before entering a position, it becomes harder to determine which conditions actually contribute to its edge.
Before adding another rule, ask:
- Does it have a logical or economic reason?
- Does it improve performance across different periods?
- Does the strategy still make sense without it?
- Does the rule remain reasonable outside the development sample?
Removing unnecessary conditions can result in a simpler strategy that is easier to understand and potentially more robust across market environments.
Small or Unrepresentative Data Samples
A strategy based on a short period can accidentally become tailored to one particular market regime.
For example, a strategy developed entirely during a strong bull market may appear highly effective without ever being tested during bearish, sideways, or high-volatility conditions.
A larger and more diverse historical sample does not guarantee robustness, but it provides more opportunities to discover whether performance depends on one unusual environment.
Repeated Testing Against the Same Dataset
This is particularly important.
A trader can test a strategy, adjust variables, test again, identify weaknesses, modify the rules, and repeat the process hundreds of times.
Even if every individual change seems reasonable, repeatedly making decisions based on the same historical sample gradually incorporates that sample into the optimization process.
As a result, the final strategy may be influenced heavily by the same data it is later being judged against.
Once a dataset has repeatedly influenced strategy decisions, it should no longer be treated as truly unseen validation data
Backtesting Overfitting: What Should You Watch For?
Backtesting is useful because it allows traders to study how a strategy would have behaved historically. The problem begins when historical data becomes an optimization game.
The purpose of a backtest should be to investigate whether a strategy has credible evidence behind its logic, not to repeatedly search for the most attractive historical equity curve.
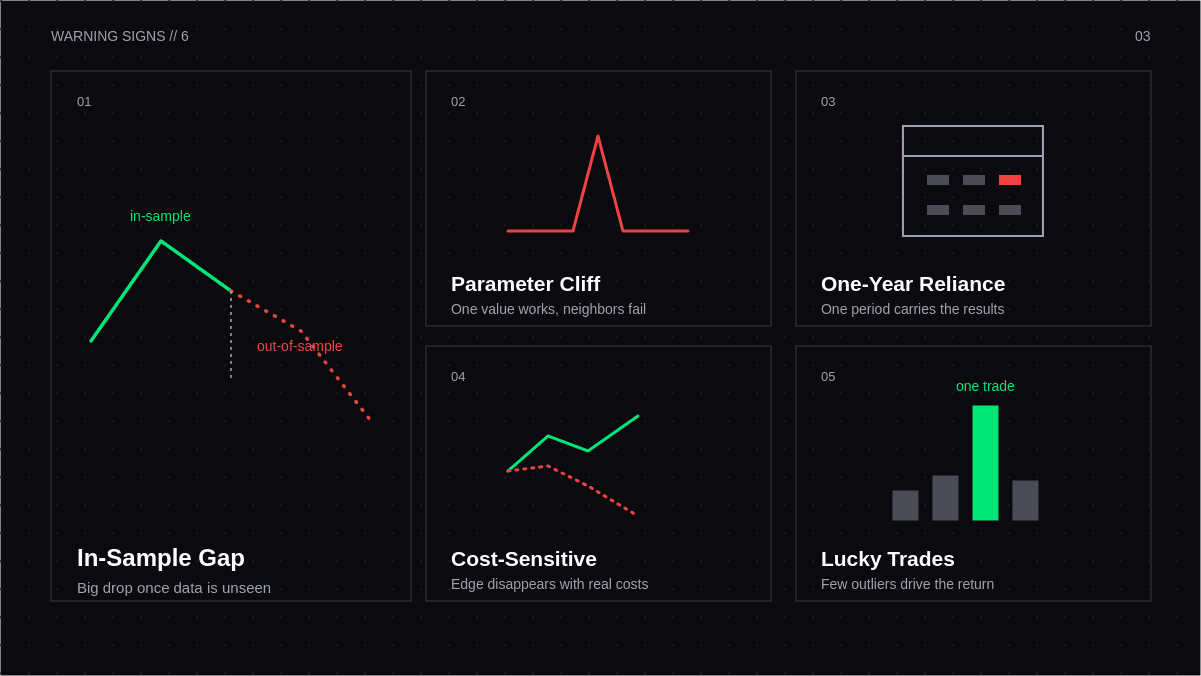
Signs of possible backtesting overfitting include:
- Very good historical performance without a convincing explanation
- A large gap between in-sample and out-of-sample results
- Performance collapsing after small parameter changes
- Strong reliance on a specific year or market environment
- Too many parameters in the optimization process
- Performance disappearing after realistic trading costs are included
- Results changing substantially when the timeframe changes
- Performance depending on a small number of unusually profitable trades
Test Parameter Sensitivity
One useful way to investigate overfitting is parameter sensitivity.
Do not focus only on the exact parameter value that produces the highest return. Instead, examine whether nearby values produce reasonably similar results.
For example, suppose a moving average performs extremely well at exactly 37 periods, but performance deteriorates dramatically at 36 or 38 periods.
That isolated peak deserves additional investigation. A more robust strategy will often have a reasonable range of nearby parameter values that produce broadly similar results.
How to Avoid Overfitting a Trading Strategy
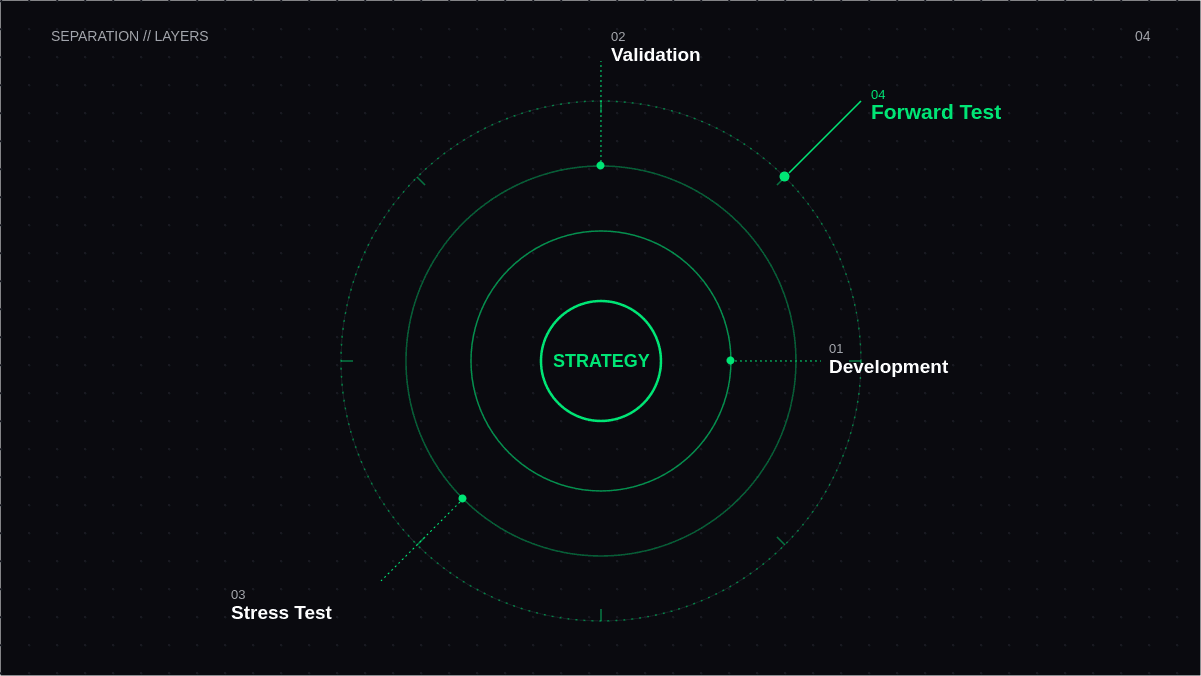
There is no single test that can prove a strategy is robust. A stronger approach is to create multiple layers of separation between strategy development, validation, stress testing, and forward evaluation.
1. Keep the Strategy Concept Simple
Begin by formulating a clear market hypothesis.
Ask:
- What market behavior is the strategy trying to capture?
- Why is that behavior expected to occur?
- When should the strategy work?
- When should it struggle?
- What are the most important variables?
Fewer, economically or logically important rules are generally easier to validate than a complex collection of filters.
Complexity is not automatically bad when it is necessary. However, unnecessary complexity can make it easier to fit random historical patterns.
A useful rule is that every additional condition should have a reason beyond “it improved the backtest.”
2. Separate Development Data From Validation Data
One of the best ways to protect the integrity of the testing process is to separate data into different stages.
Development data is used to build and improve the strategy.
Validation data is reserved for evaluating whether the completed strategy works beyond the information used during development.
| Stage | Purpose |
|---|---|
| Development sample | Build the initial strategy |
| Optimization sample | Refine necessary parameters |
| Out-of-sample sample | Test unseen historical data |
| Forward testing | Observe behavior under new data |
| Live deployment | Evaluate real execution |
The important principle is that data reserved for validation should not repeatedly become part of the optimization process.
If you use validation results to change the strategy and then test it on that same data again, the data is no longer truly out of sample.
3. Use Out-of-Sample Testing
The out-of-sample test asks a straightforward question:
Does the strategy still work on data it did not use to develop its rules?
Strong performance on development data followed by reasonable performance on out-of-sample data is more encouraging than an exceptional backtest followed by poor results on unseen data.
However, an out-of-sample test is not a guarantee of future profitability. One successful period may simply represent another favorable market environment.
The more important goal is to build a body of evidence across different periods and conditions rather than relying on one successful test.
4. Test Across Different Market Regimes
A strategy should not be evaluated only in the environment where it performs best.
Consider testing across:
- Strong uptrends
- Strong downtrends
- Sideways markets
- High-volatility periods
- Low-volatility periods
- Fast market reversals
- Extended periods of limited price movement
Not every strategy needs to work in every environment.
For example, a momentum strategy may reasonably struggle in a low-volatility sideways market.
The important question is why performance changes.
Document the environments where the strategy is expected to work and where it is expected to struggle. This makes future validation more objective and helps distinguish a known limitation from an accidental loss of edge.
5. Use Walk-Forward Testing
Another approach for determining how adaptable a strategy is would be walk-forward testing.
The basic process is:
Optimize the strategy on a defined historical window.
Test it on the following unseen period.
Move the testing window forward.
Repeat this process.
Assess the outcomes.
Thus, there will be several development and backtesting periods instead of using only one historical split. Walk-forward testing is important since it mimics the actual process of developing the system, implementing it in new data, and checking its performance.
6. Stress-Test the Strategy
Backtest under idealistic assumptions can cause the strategy to look like it is stronger than what it actually is.
| Stress Test | Factors to Investigate |
|---|---|
| Transaction Costs | Can profitability withstand the increase? |
| Slippage | Is the edge sensitive to the difference in execution? |
| Spread | Is there a wide spread that makes a big difference? |
| Entry Delay | Can there be any entry delays that ruin the strategy? |
| Exit Delay | How critical is the system to perfect execution? |
| Parameter Changes | Does the performance withstand close parameters? |
| Market Regime | Can the strategy withstand various market regimes? |
| Trade Sequence | How bad can the drawdowns get? |
It is not necessary for all the stress tests to end up profitable. The objective here is to investigate whether reasonable changes lead to gradual deterioration or immediate collapse of the strategy.
7. Perform Monte Carlo Analysis
The sequence of the trades made may influence the end results of the equity curve.
With Monte Carlo analysis, traders are able to study how various trade sequences will impact such things as drawdowns, losing streaks, and final equity.
This allows one to discover what questions cannot be answered by a single equity curve:
- How big might a realistic drawdown get?
- How long might a losing streak last?
- Is the strategy still acceptable with other trade sequences?
- Is there any dependence on favorable trade sequencing when it comes to performance?
Monte Carlo analysis is especially effective in determining possible outcomes of risk.
8. Include Realistic Trading Costs
An algorithmic approach, which has some theoretical advantages, can turn out to be unprofitable due to implementation costs.
The factors to consider are as follows:
- Commissions
- Bid-ask spread
- Slippage
- Financing cost (if necessary)
- Market impact for bigger volumes
The lower the theoretical advantage of an approach, the more significant the role of the above assumptions.
If a strategy is profitable solely because of zero transaction costs and slippage assumption, then this fact needs to be considered carefully.
9. Avoid Optimizing for One Performance Metric
The maximum return in itself is not sufficient in creating robustness.
Some other factors that can be analyzed include:
- Maximum drawdown
- Risk-adjusted return
- Profit factor
- Win/Loss ratio
- Trade frequency
- Average trade
- Recovery
- Consistency
- Exposure
- Cost sensitivity
For instance, Strategy A can give better returns compared to Strategy B but have deeper drawdowns.
The better option will depend upon the nature of risk of the strategy in question and not on just the return.
A strategy with lower but stable performance can be preferred to an exceptional one which works only under certain historical circumstances.
Trading Strategy Overfitting Checklist
This checklist is useful as a practical final test before implementing a strategy that is ready to transition from back-testing into forward-testing. This checklist can be saved or printed as a single page strategy validation sheet.
Strategy Design
☐ I can provide a clear explanation of the market hypothesis supporting my strategy.
☐ Each of the important rules has its own logic or economic basis.
☐ The strategy is free of any unnecessary filters and/or parameters.
☐ I know what kinds of market situations will favor my strategy.
☐ I know what kinds of market situations can negatively affect the strategy’s performance.
Data and Strategy Validation
☐ Development and validation samples are independent.
☐ Out-of-sample data has not been reused in an attempt to optimize a strategy.
☐ The strategy has been tested in various market conditions.
☐ Performance is not completely dependent on a single year or period of time.
Robustness
☐ Nearby parameters yield relatively similar performance.
☐ The impact of higher transaction costs has been examined.
☐ Slippage and delays in executions have been taken into account.
☐ The strategy has been backtested using more conservative assumptions.
☐ Losing sequences and drawdowns are bearable.
☐ The strategy is not highly sensitive to any particularly profitable trades.
Final Review
☐ The strategy was not chosen only due to its best historical performance.
☐ The strategy remains explainable even if some assumptions change.
☐ The strategy has been backtested on data not used for its development.
☐ Forward testing will be done before using it in practice.
☐ I am aware that past verification does not guarantee future success.
If several boxes above remain unchecked, the answer does not lie in optimizing the strategy. Making the model simpler, improving its validation, or gathering better data can be the way to go instead.
A Practical Robustness Testing Framework
This is a methodology for performing robustness tests to turn the process into something repeatable.
| Step | Questions |
|---|---|
| Define hypothesis | Why should this strategy work? |
| Build baseline | Can the idea work without excessive complexity? |
| Separate data | Which data will remain unseen? |
| Optimize carefully | Are only necessary parameters being adjusted? |
| Test sensitivity | Do nearby parameters produce similar behavior? |
| Validate out-of-sample | Does performance survive unseen data? |
| Stress execution | What happens with higher costs and slippage? |
| Test regimes | How does the strategy behave in different environments? |
| Walk forward | Does performance persist across rolling periods? |
| Review risk | Are drawdowns and losing streaks acceptable? |
| Forward test | Does behavior remain consistent outside the original backtest? |
This process shifts the objective from finding the best historical strategy to finding a strategy that remains reasonably credible when historical assumptions change for algorithmic strategies.
Common Mistakes When Testing Trading Strategies
Preventing overfitting is not as simple as running more backtests. Some typical errors include:
- Perfecting the historical equity curve through optimization
- Using the same data for both development and final verification
- Introducing rules every time an unfavorable trade is generated
- Ignoring transaction costs and slippage
- Testing only under ideal market conditions
- Selecting parameter values based only on highest returns
- Treating a single out-of-sample period as sufficient proof
- Assuming complexity guarantees superiority
A useful question to ask after every strategy adjustment is: “Would I have made this change if I had not already seen the historical result?”
If the answer is no, the change may have been influenced by the historical sample.
Conclusion
Avoiding overfitting trading strategy developmentinvolves altering the objective to testing whether the strategy will maintain credibility when faced with circumstances in which it is not optimized specifically.
Data separation, parameter sensitivity, analyzing multiple market environments, and using execution conditions which are realistic will make the testing process much more relevant.
However, no form of validation can assure profitability going forward. Markets change, execution situations change, and edges become obsolete. The real goal is to develop sufficient evidence that the strategy is not relying on noise in the historical data.
A trading strategy which is less optimized historically but has maintained stability through testing involving new data, realistic parameter values, alternative markets, and realistic costs is potentially much more valuable than a strategy which has performed extremely well historically but is highly optimized.