Looking for a non repainting buy sell indicator could be a daunting task. Almost all of them claim that they give highly accurate buy and sell signals; however, many traders end up realizing that their signals were accurate because they repaint after the closing of the candle. It is very frustrating to use an indicator that gives unrealistic signals, which results in poor decisions.
No matter whether you are trading on Forex, crypto, stocks or indices, it is important for you to use an indicator that maintains its past signals unaltered to backtest and analyze your strategy effectively. These buy sell indicators will not ensure profits for you in every trade, but at least you get an accurate view of performance of the indicator.
In this article, you will learn about what non repainting indicator is, how it works, how to spot fake indicators, what features you should look for and more.
What Is a Non Repainting Buy Sell Indicator?
A non repainting buy sell indicator refers to an instrument used in technical analysis which gives trade signals which do not get altered or deleted once a candlestick has closed. The trade signal once created does not change its position, thus making it possible for traders to analyze past performance. Premium tools like the GainzAlgo V2 Alpha Indicator ensure signals remain fixed for accurate backtesting.
The difference between this kind of technical indicator and other painting indicators lies in the fact that this indicator will not delete or alter its signals even with new information about the markets.
Most of today's buy and sell indicators consider the relationship between several indicators instead of just one. Such indicators consider such elements as:
- Trends direction
- Momentum
- Volatility
- Volume (if present)
- Support/resistance
- Convergence/divergence of moving averages
Once all the above-mentioned criteria match pre-defined conditions, a buy and sell signal is produced by the indicator.
While most indicators claim exceptional accuracy, it's necessary to keep in mind that not a single indicator will be able to predict price movements with certainty. What's needed is to have consistent and repeatable signals.
Repainting vs Non-Repainting
The table below highlights the key differences between repainting and non-repainting indicators and shows how they can affect signal reliability and strategy evaluation.
| Feature | Repainting Indicator | Non Repainting Indicator |
|---|---|---|
| Historical Signals | Can Changed | Remain Fixed |
| Backtesting | Misleading | Reliable |
| Live Performance | Often inconsistent | More Predictable |
| Signal history | May disappear | Preserved |
| Strategy evaluation | Difficult | Accurate |
| User confidence | Lower | Higher |
Why Indicators Repaint
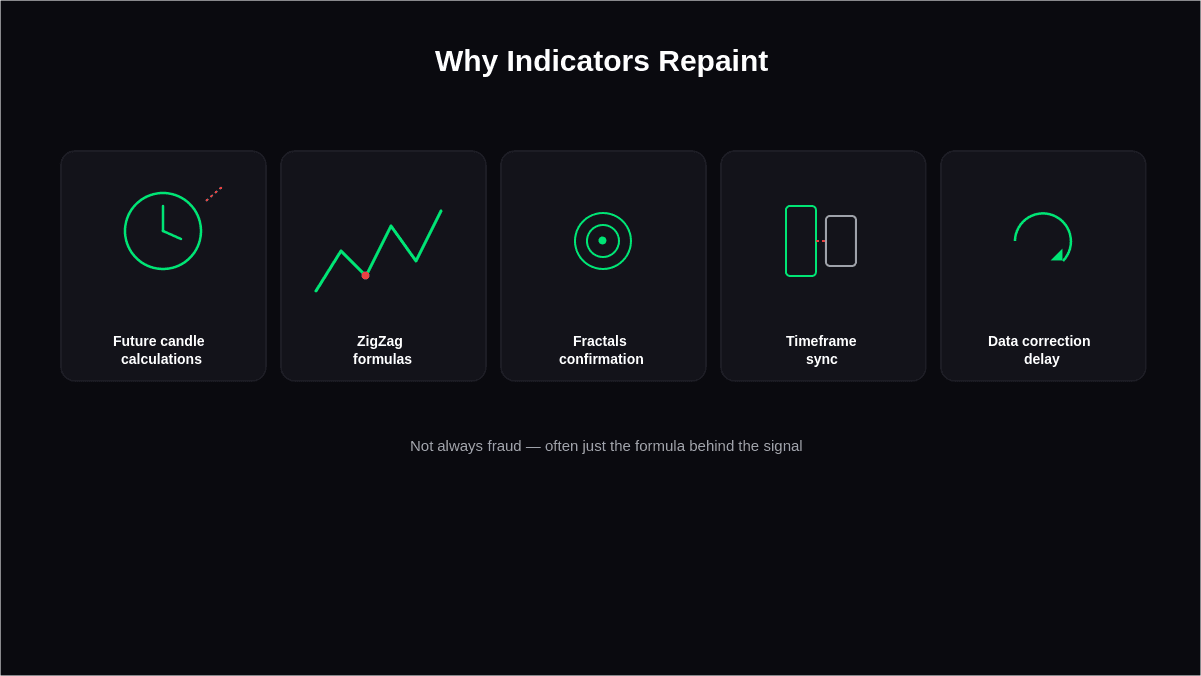
Every repainting indicator does not necessarily have to be fraudulent in nature. Repainting may occur due to the formulas that traders use while making calculations.
Some of the factors are:
- Calculations for future candles
- ZigZag formulas
- Fractals confirmation
- Time frames synchronization
- Delay in data correction
This knowledge will allow traders to differentiate between analytical indicators and those that should not be used for live trading.
Best Markets & Timeframes
The market for every trader does not have to be the same.
Usually:
- Forex gives consistent trends.
- Crypto gives wider moves with high risks involved.
- Stocks have advantages in earnings and sector trends.
- Indices give smoother moves in direction.
Select the market which suits your skill level and risk taking capacity.
After choosing the market that best fits your trading style, it is equally important to consider the timeframe you will use, as it can significantly affect the frequency and quality of trading signals. Lower timeframes offer more trading opportunities but come with greater market noise, while higher timeframes produce fewer signals that are generally more reliable.Below you will find more in depth details of each:
Lower Timeframes
| Advantages | Disadvantages | Column 3 |
|---|---|---|
| More trading opportunities | Faster feedback | Suitable for active traders |
| Higher market noise | More false signals | Greater emotional pressure |
Higher Timeframes
| Advantages | Disadvantages | Column 3 |
|---|---|---|
| Cleaner trends | Reduced noise | Better signal quality |
| Fewer setups | Longer holding periods | Increased patience required |
Many experienced traders wait for a signal on the 4-hour or daily chart before refining entries on lower timeframes.
How to Verify a Non-Repainting Indicator Yourself
Claims from marketing should never be a substitute for testing by yourself.
Fortunately, checking if the indicator really does not repaint can be quite simple as long as you go through a certain procedure.
Step 1: Use Replay Mode
TradingView's Replay feature allows you to play through the historical chart candle-by-candle. Just watch if the signals stay static after each candle has closed. If they vanish or change positions, then the indicator repaints.
Step 2: Test in Live Markets
Testing of historical data is not sufficient. Test the indicator during live trading hours and note any new signals that are generated. Compare them with historical charts.
Step 3: Wait for Candle Close
Some indicators generate false signals when the candle is in formation. Signals must be evaluated only after the formation of the candle.
Step 4: Forward Test on a Demo Account
Trade the signals in a simulated environment before risking real money.
Record:
- Entry price
- Exit price
- Win rate
- Risk-to-reward ratio
- Maximum drawdown
A few weeks of forward testing can reveal strengths and weaknesses that historical charts may hide.
Step 5: Compare Historical Charts
Take screenshots for several days. Then compare these screenshots to the chart that you have now. Absence or shifting of the signals means that there is painting.
Step 6: Check Alert Timing
Reputable alerts need to be triggered at the moment when the signal appears on the chart. This will make the indicator less useful.
Step 7: Review the Documentation
Professional developers usually explain:
- Signal logic
- Recommended markets
- Timeframes
- Risk management
- Known limitations
Transparent documentation often reflects a more trustworthy product.
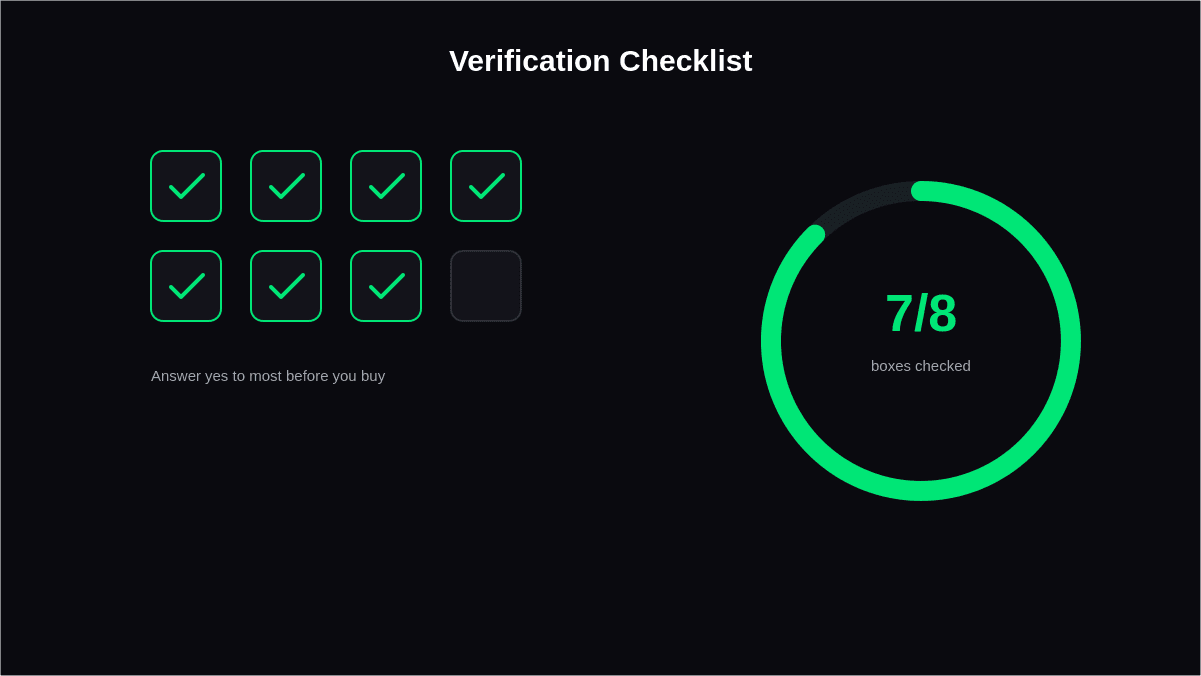
Verification Checklist
Before buying, make sure you can answer Yes to most of these questions.
- Are historical signals fixed?
- Have you tested Replay Mode?
- Have you watched live signals?
- Are alerts reliable?
- Is documentation available?
- Does the developer provide updates?
- Does the indicator fit your trading style?
- Have you tested it on a demo account?
A good non-repainting indicator must satisfy most, if not all, of these criteria before considering its application in real-life trading situations.
There are several mistakes traders make when working with trading indicators, which are rather elementary in nature but limit their effectiveness. They are the following.
- Trading on the basis of marketing promises
- Not paying attention to the overall trend
- Taking every signal into account
- Using too many indicators at once
- Neglecting risk management
- Changing indicator parameters frequently
- Not using demo account
What to Look for Before Buying
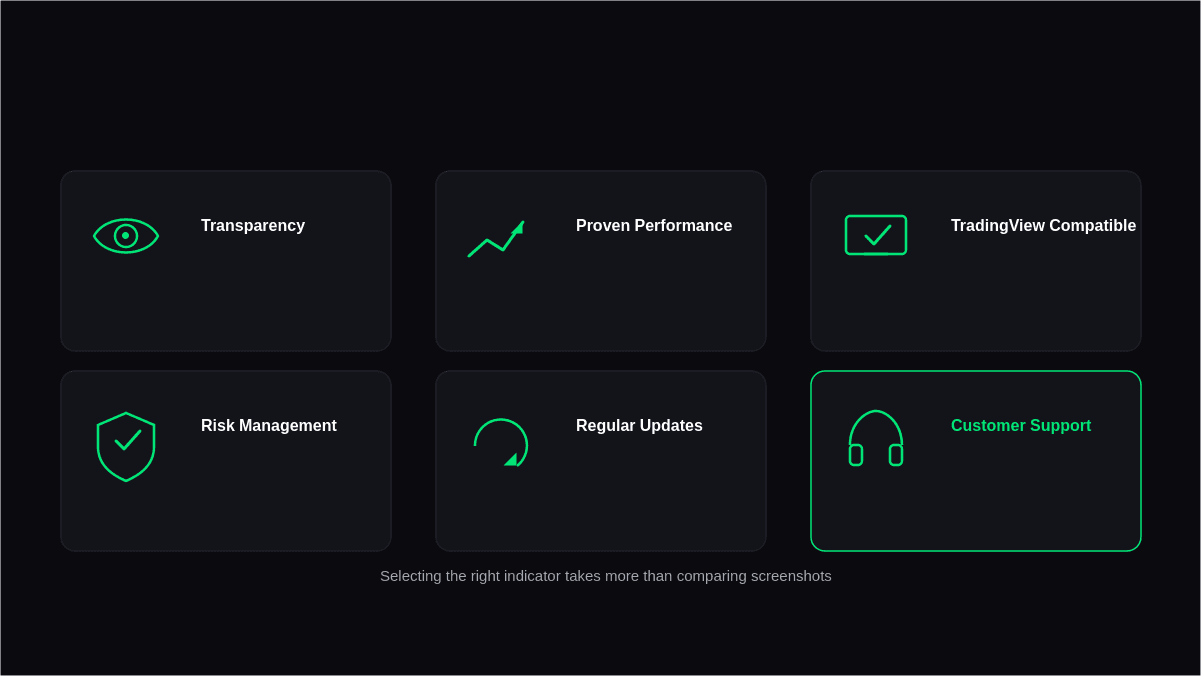
With hundreds of options available, selecting the best non repainting indicator requires more than comparing screenshots.
Use the following checklist before making a purchase.
- Transparency
- Proven performance
- TradingView compatibility
- Risk management features
- Regular updates
- Customer support
Is Non-Repainting Buy-Sell Indicator Worth Buying?
If you prefer transparency and strategic planning, a non repainting Buy/Sell indicator may be a good option for you to think about.
Nevertheless, keep in mind:
- It is a tool that helps make decisions.
- It does not substitute trading skills.
- It should supplement market analysis.
Final Thoughts
A good buy-sell indicator is not an indicator which will tell you everything that happens in the market; it is an indicator which provides consistent signals which are trustworthy in backtests as well as in real-time trading situations.
When trading the Forex, cryptocurrency, stock, or index markets, one thing to always keep in mind is that no indicator is a holy grail, and the best trading decisions are made by combining signals with trends and good risk management.
Frequently Asked Questions
What is a non repainting buy sell indicator?
Non repainting buy sell indicators are trading indicators that generate buy and sell signals which do not change or repaint once the candle closes. This way traders can look back at the history of the signals generated and assess the actual performance of the indicator as opposed to the signals generated from manipulated charts.
Does a non repainting indicator guarantee profitable trades?
No. The purpose of the non-repainting indicator is to make sure that the already made signals do not change. This does not mean that it will give winning trades or prevent you from losing money on the market.
How can I verify if an indicator is truly non repainting?
This technique is reliable when you test it on your own through TradingView’s Replay Mode under real trading conditions and see whether the signals stay at the same point after candle closure. When the signals that appear in history move, the indicator is repainting.
Is a paid indicator better than a free one?
Not really. Some free indicators do a really good job, whereas some paid indicators depend more on their marketing capabilities than actual performance. It is better to look for certain other qualities of an indicator rather than its price.