Technical analysis becomes more beneficial for traders if they understand how to read different kinds of information on the markets simultaneously. Working with several trading indicators together can help to confirm the trend, determine momentum, find entry points, and realize when the setup starts getting weaker.
But remember it's always not useful sometimes using multiple trading indicators does not guarantee better accuracy. What should traders aim at is not filling their charts with signals. What they need to do is to use different tools that will answer different questions on price behavior and then act according to their trading plan
This guide covers how to put together trading indicator combinations that hold up, how to pick technical analysis tools that complement each other rather than repeat each other, and how to apply that to different trading styles.
It also gets into structuring indicator-based rules, handling signals that disagree, managing risk, and backtesting before any of it touches real capital.
What Are Multiple Trading Indicators?
Multiple trading indicators just means two or more technical tools used together to read the market.Each one conducts its own computation based on price, volume, or both, and are each designed to address a certain type of question.
A few examples include:
- RSI: measures momentum and flags relatively strong or weak price conditions.
- ATR: measures volatility and typical price movement.
- Volume: shows how much trading activity is behind a price move.
- VWAP: gives intraday traders a volume-weighted reference price.
- MACD: helps assess momentum and potential trend changes.
- Moving averages: determine trend direction and strength.
- Bollinger Bands: show price movement relative to a moving average and volatility range.
An algorithmic trading indicator may fold several of these calculations into one structured view of price behavior. Whatever the mix, each indicator on the chart should have a job.
| Market Question | Indicator | What It Measures | How It Can Be Used |
|---|---|---|---|
| What is the overall direction? | Moving average | Trend | Establish directional bias |
| Is momentum supporting the move? | RSI | Momentum | Confirm or question the trend |
| How volatile is the market? | ATR | Volatility | Assess price movement and risk |
| Is the move attracting participation? | Volume | Trading activity | Confirm market participation |
| Where is the trade idea invalid? | Price structure | Support and resistance | Define risk and exits |
Thinking in these terms keeps traders from bolting on a new indicator just because it produced a signal that looked good in hindsight.
Why Combine Indicators in Technical Analysis?
No single indicator covers every angle of market behavior. A moving average shows the broader trend but tends to lag once conditions shift. RSI shows momentum, but an overbought reading on its own doesn't mean price is about to turn. ATR shows how much a market is moving, not which way it's headed.
The combination of instruments helps you analyze multiple aspects of one particular configuration. Here is a basic example of how the configuration can be built:
Trend → Momentum → Confirmation → Volatility → Risk
In reality, this may come down to analyzing the trend, seeing if it has the momentum (based on RSI), confirming the trend (volume), analyzing volatility (ATR) and setting the invalidation point based on price action.
The goal is a decision process, not a pile of signals. Using a stablenon-repaint buy sell signals algorithm can often help eliminate shifting data confusion.
How to Build a Trading Indicator Combination
Start with the strategy, then pick indicators that support it, not the other way around.
1. Define What You Want to Trade
Decide what kind of market behavior you're actually targeting:
●Trend continuation
●Swing reversals
●Intraday momentum
●Breakouts
●Mean reversion
●Range trading
The strategy determines which information actually matters.
2. Assign Each Indicator a Specific Role
Pick tools based on the questions you need answered:
●Moving average: is the market trending?
●RSI: is momentum supporting the move?
●Volume: is participation increasing?
●ATR: how volatile is the market?
●Price structure: where does the trade idea become invalid?
That gives the indicators a logical relationship to each other instead of just sitting on the same chart.
3. Turn the Analysis Into Rules
Skip vague instructions like "enter when the indicators look bullish." Define conditions you can actually measure:
●Price is above the 50-period moving average.
●RSI moves above 50 after a pullback.
●Volume increases during the upward move.
●Price breaks above nearby resistance.
●The stop-loss sits below the predefined invalidation level.
Rules written this way can actually be tested.
4. Define Risk Before Entry
Indicators can point to opportunities, but they don't remove trading risk. Before entering, nail down:
●Entry price
●Stop-loss level
●Position size
●Maximum risk per trade
●Profit target or exit condition
●Trade invalidation point
Best Trading Indicator Combinations
Different trading styles call for different combinations, and a setup that works on a daily chart won't necessarily hold up on a five-minute chart. The examples below show how to pair indicators to a given type of setup.
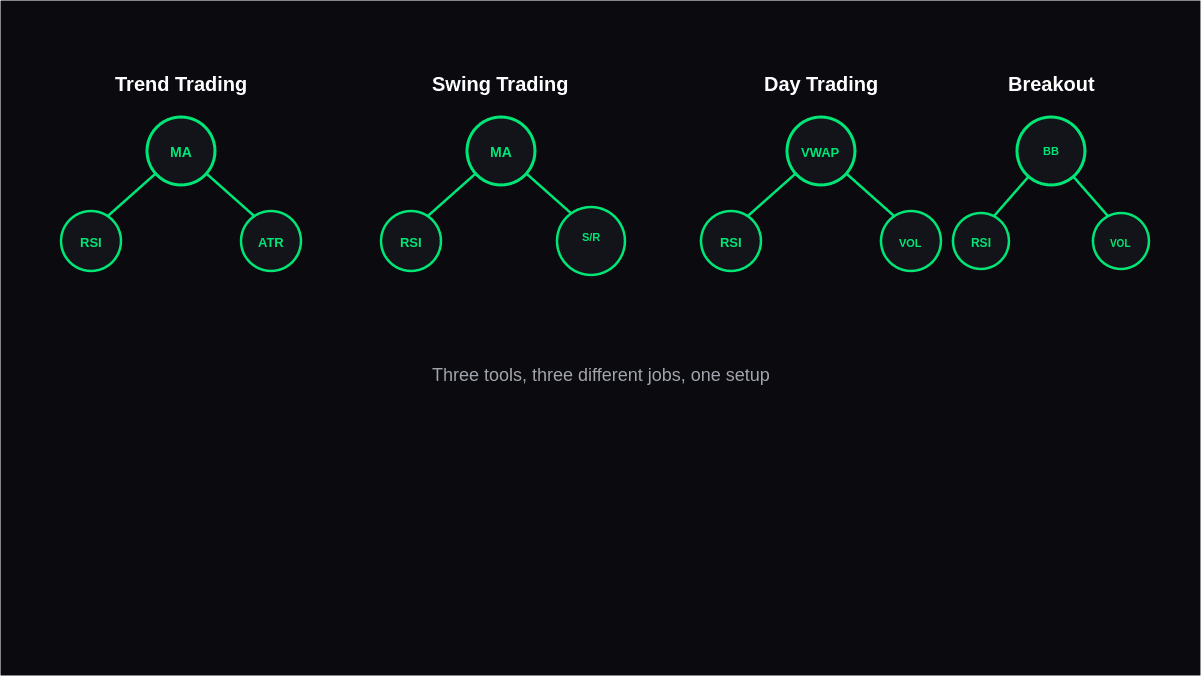
Trend Trading: Moving Average + RSI + ATR
This combination is built for identifying and following established trends. The moving average sets the general direction, RSI checks momentum, and ATR adds volatility context.
A bullish version could look like this:
●Price remains above the 50-period moving average.
●The moving average is rising.
●RSI remains above 50 during pullbacks.
●ATR shows sufficient price movement for the strategy.
●Price forms a bullish continuation pattern.
The trade goes in once the predefined confirmation condition shows up. The moving average handles the trend question, RSI handles momentum, and ATR fills in the volatility picture.
Swing Trading: Moving Average + RSI + Support/Resistance
This one suits multi-day and multi-week setups, where the trader needs to read the broader trend while still finding a reasonable pullback entry.
A potential bullish setup:
●Price trading above the 50-period moving average.
●A pullback toward an established support area.
●RSI weakening during the pullback but staying consistent with the broader bullish structure.
●Price showing a bullish reaction near support.
●The trade is invalidated if the support level fails.
This combination brings trend, momentum, and price structure into the same read. The indicators don't make the call by themselves, the trader still has to weigh where price sits within the broader market structure.
Day Trading Momentum: VWAP + RSI + Volume
Built for intraday momentum setups. VWAP acts as the intraday reference point, RSI reads momentum, and volume shows whether participation is picking up.
A potential bullish setup:
●Price holds above VWAP.
●RSI moves above 50 after a short pullback.
●Volume increases as buyers return.
●Price breaks above a recent intraday high.
●The trade is entered according to predefined risk rules.
GainzAlgo's existing guide on TradingView indicators for 1-minute scalping covers indicator combinations for short-term trading in more depth.
Breakout Trading: Bollinger Bands + Volume + RSI
Suited to breakouts out of consolidation. Bollinger Bands flag changes in price expansion and contraction, volume shows participation, and RSI checks momentum.
A bullish breakout framework:
●Price consolidating within a defined range.
●Bollinger Bands becoming relatively narrow.
●Price breaking above resistance.
●Volume increased during the breakout.
●RSI confirming stronger bullish momentum.
A breakout still needs to be checked against the broader market structure, a brief move above resistance doesn't guarantee it holds.
Mean Reversion: Bollinger Bands + RSI + Support/Resistance
Built for range-bound markets, where the goal is spotting price that's moved unusually far from its typical range.
A potential setup:
●Price reaches the lower Bollinger Band.
●RSI moves into an oversold area.
●Price approaches established support.
●A reversal pattern develops.
●The trade is invalidated if support breaks.
This setup needs different market conditions than a trend-following strategy does. A deeply oversold reading in a strong downtrend can stay oversold for a long time while price keeps falling.
Short-Term Trend Trading: EMA + Supertrend + Volume
Geared toward short-term trend-following. EMA responds to changes in price reasonably fast, Supertrend is a filter for trends, and the volume adds more information regarding participation.
A possible bullish set-up can be:
●Price trades above the EMA.
●Supertrend shows an uptrend.
●Price trades above a previous support level.
●There is an increase in volume during a continuation phase.
●The trade happens only when all the previously mentioned criteria come together.
This sort of strategy suits those traders who do not want to chase reversals but ride existing trends.
Indicators Selection Based on Your Trading Style
A starting framework for matching your indicators with the strategy:
| Trading Style | Trend Indicator | Momentum Indicator Confirmation | Volatility Indicator | Column 5 |
|---|---|---|---|---|
| Trend | 50/200 MA | RSI | Price formation | ATR |
| Swing | 50 MA | RSI | Support/Resistance levels | ATR |
| Day | VWAP/EMA | RSI | Volume | ATR |
| Momentum | EMA | RSI/MACD | Volume | ATR |
| Breakout | Bollinger Bands | RSI | Volume | ATR |
| Mean Reversion | Bollinger Bands | RSI | Support/resistance | ATR |
These are starting points, not fixed formulas, the right settings depend on the asset, timeframe, market conditions, and the trader's own rules.
How to Handle Conflicting Indicator Signals
Indicators may contradict each other at times. Price can be above the moving average while RSI is below 50, but that does not indicate that one of the two indicators is wrong. The two indicators just measure different aspects of the same condition.
Instead of choosing any signals that fit the trade you intend to undertake, determine the hierarchy of the signals before the analysis:
●The trend dictates the direction.
●The momentum signals if there is strength behind the move.
●The price structure indicates the entry point.
●The volatility shows whether the risk parameters of the trade are practical.
●The volume provides additional confirmation where necessary.
Indicator Confluence vs. Signal Counting
Confluence implies that different sources of information are suggesting the same market setup. For instance, consider a share that is:
●Trading above an ascending 50-period MA
●Retracing towards its support zone
●Experiencing a rally in RSI above 50
●Demonstrating growing volumes on its rebound
All those signals measure a different aspect of the situation; the moving average measures the trend direction, support measures the price level, RSI measures momentum, and the volume indicates participation.
It makes a more convincing case than having three momentum indicators reacting to the same price movement.
Confluence does not require multiple indicators in one direction but requires independent confirmation.
How to Avoid Redundant Indicators
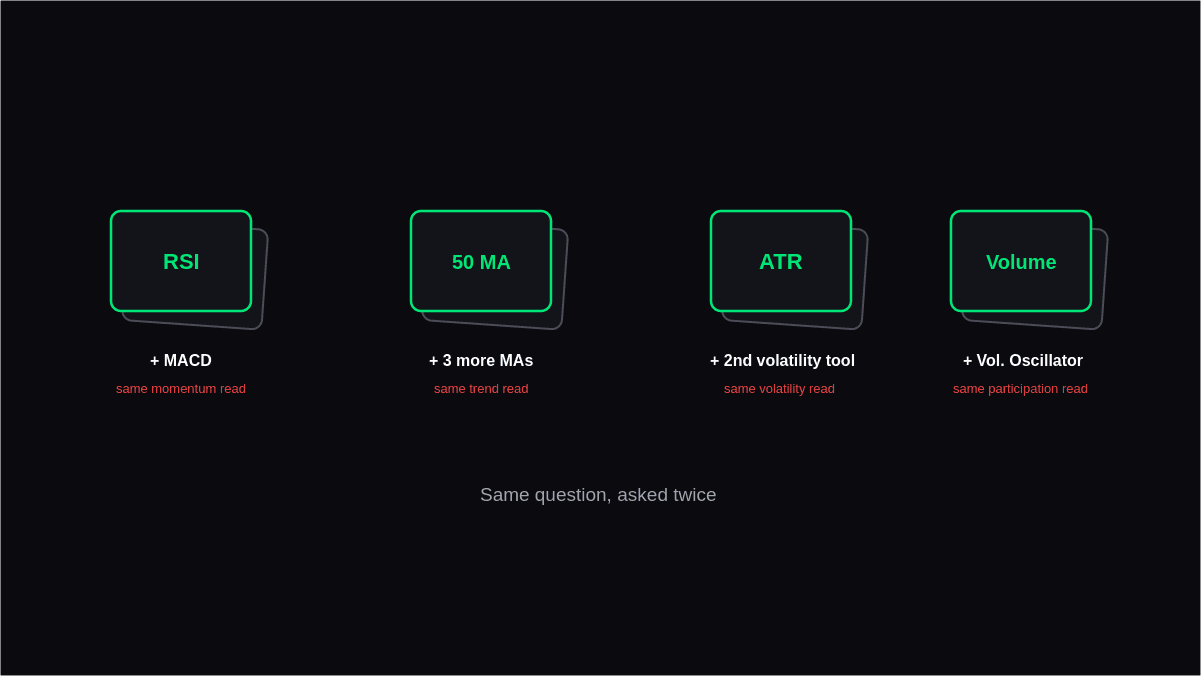
This is the actual problem with using lots of indicators in your strategy. If many different indicators are measuring the same thing, it makes sense that adding another just makes things redundant. One simple way to figure this out is by asking, "What does this indicator tell me that I don't already know?"
| Current Tool | New Tool | Potential Issue |
|---|---|---|
| RSI | Stochastic RSI | Both focus heavily on momentum |
| 50 MA | 20 MA + 100 MA + 200 MA | Multiple trend references may complicate the decision |
| ATR | Another volatility indicator | May provide overlapping volatility information |
| Volume | Another volume oscillator | May duplicate participation data |
None of this suggests that this type of combination can never be successful, however, the extra tool will require some purpose, and should improve results in tests.
The starting framework can be trend + momentum + volatility, for example MA, RSI and ATR. After this point, include only volume or price pattern if tests show some improvement.
The idea is to create a trading strategy that can be easily explained, backtested and managed.
Backtesting Multiple Trading Indicators
A combination needs to be tested before it touches real capital. Start by writing the rules out plainly:
●Asset or market
●Timeframe
●Indicator names
●Indicator settings
●Entry conditions
●Exit conditions
●Stop-loss rules
●Position-sizing rules
●Maximum risk per trade
●Conditions that invalidate the setup
Then run a historical backtest on the full strategy.
Win rate alone isn't enough to judge a strategy. Review:
●Total return
●Average winning trade
●Average losing trade
●Profit factor
●Maximum drawdown
●Losing streaks
●Number of trades
●Performance across different market conditions
●Performance during high-volatility periods
A strategy can post a high win rate and still perform poorly if its losses run much bigger than its wins. Resist the urge to keep tweaking indicator settings until the historical results look perfect,that's how strategies get overfit to the past and fall apart on new data.
Check for Repainting Before Trusting Historical Signals
Indicator systems may alter their signals depending on the latest price, which will cause the historical chart to appear much more accurate than it really was during the actual trading time.
An assessment of an indicator based system must take into account the fact whether the signals remain unaltered once the related candle is closed.
The non-repaint buy sell signals explained section on the website deals with this problem more thoroughly. The strategy must be evaluated using only the information available during the trading process.
A Practical Workflow for Using Multiple Indicators
Once the indicators and the rules have been determined, follow these steps on all setups that will be generated.
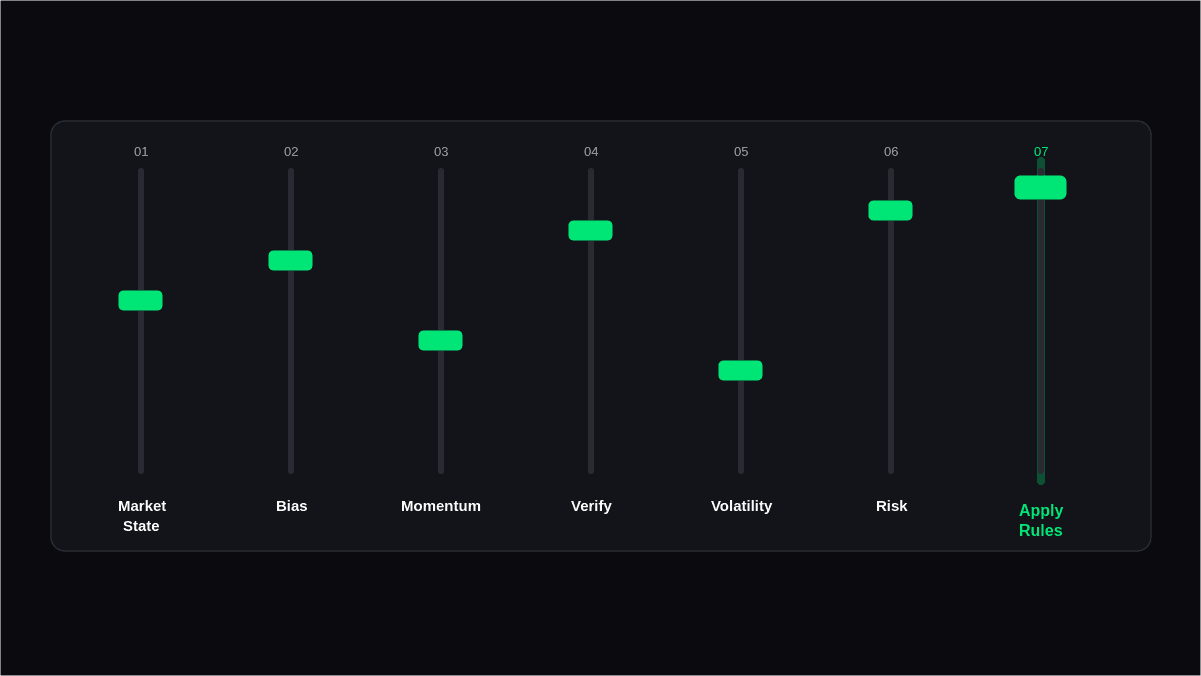
Step 1: Determine the Market State
Determine whether the market state is Bullish, Bearish, Range, Breakout, or Extremely Volatile.
Step 2: Determine the Bias
Using the primary trend indicators such as Moving Averages or VWAP, identify whether there is a Bullish or Bearish bias.
Step 3: Look for Momentum
Use RSI and MACD to find out whether momentum confirms the bias.
Step 4: Verify the Setup
Check price structure, volume or some other information that is independent of the rest of the setup.
Step 5: Check Volatility
ATR will be used to determine the level of price action currently happening.
Step 6: Determine Risk
The level of invalidation and position sizing should be determined.
Step 7: Apply the Rules
If the setup does not fit your rules, then just wait for the next one.
This should be done systematically, and the indicator combination becomes a system rather than just individual chart patterns.
How to Keep an Indicator-Based Strategy Clear
A good indicator strategy should be easy to explain without walking through a long list of conditions:
●Moving average: identifies the broader trend.
●RSI: evaluates momentum.
●ATR: measures volatility.
●Volume: checks participation.
●Price structure: defines entry and invalidation levels.
Each piece has its own job. That makes it easier to see which part of the strategy worked or didn't during testing, and it means you can adjust one component later without rebuilding the whole system.
Conclusion
Multiple trading indicators are useful when each one is answering a different market question. The trading indicator combinations that hold up combine complementary information, trend, momentum, volatility, volume, price structure, rather than piling on more of the same.
A moving average can set trend direction, RSI can read momentum, and ATR can add volatility context. Volume or price structure gets added on top when the strategy actually calls for further confirmation.
The goal was never to fit every available indicator onto one chart. Build the combination around what you're actually trying to trade, write rules you can measure, test them across different market conditions, and build in real risk management.
When each indicator has a defined role, the whole analysis gets easier to understand, execute, and evaluate.
FAQs
Is it better to use multiple trading indicators?
Multiple indicators help when they each provide a different type of information — a moving average, RSI, and ATR together cover trend, momentum, and volatility, for instance. Stacking several tools that measure the same factor adds little.
How many trading indicators should I use?
There's no fixed number. A reasonable starting point is one indicator per core function the strategy needs. Three complementary tools might be plenty for one strategy; another might call for extra confirmation.
What is indicator confluence in technical analysis?
It's when different sources of market information point to the same scenario — a bullish trend, improving momentum, rising volume, and price holding support all lining up around a potential long, for example.
Can multiple indicators give conflicting signals?
Yes. Indicators react to price at different speeds and measure different things. It helps to set rules for handling conflicts ahead of time, rather than defaulting to whichever signal supports the trade you already want.
Which indicators work well together?
Common pairings include moving averages with RSI and ATR for trend trading, VWAP with RSI and volume for day trading, and Bollinger Bands with RSI and volume for breakout or mean-reversion setups.
Do more indicators make a trading strategy more accurate?
Not necessarily. More indicators can add information, but they can just as easily add redundancy, conflicting signals, and overfitting. Complementary tools that actually improve the decision process work better than volume for its own sake.
Should I backtest multiple trading indicators?
Yes. Backtesting shows whether a combination actually improves the full strategy under historical conditions. Test the real entry, exit, stop-loss, position-sizing, and risk rules together rather than judging individual indicator signals in isolation.
Can indicators repaint?
Some indicators change their historical signals once new price information comes in. It's worth understanding how an indicator generates and confirms signals, and testing it against information that would have actually been available in real time.