Multi time frame analysis provides traders with an additional tool to analyze price action by viewing the same market on various chart time frames. Traders do not need to make decisions based on one chart alone because they can also compare the trend with the intermediate and short-term prices.
The trend may be seen on a higher time frame chart, and entry points may be found through a lower time frame chart. This method does not necessarily mean that traders will get better deals, but it will surely help them to make sense of the different pieces of price information.
It is important to note that traders must assign certain tasks to various time frames and should not switch them back and forth in a random manner.
What Is Multi time frame Analysis?
Analysis on multi time frames refers to the process of analyzing an asset on two or more chart time frames prior to deciding whether to trade. This approach does not aim at gathering more signals. Every time frame adds its own unique dimension to the analysis.
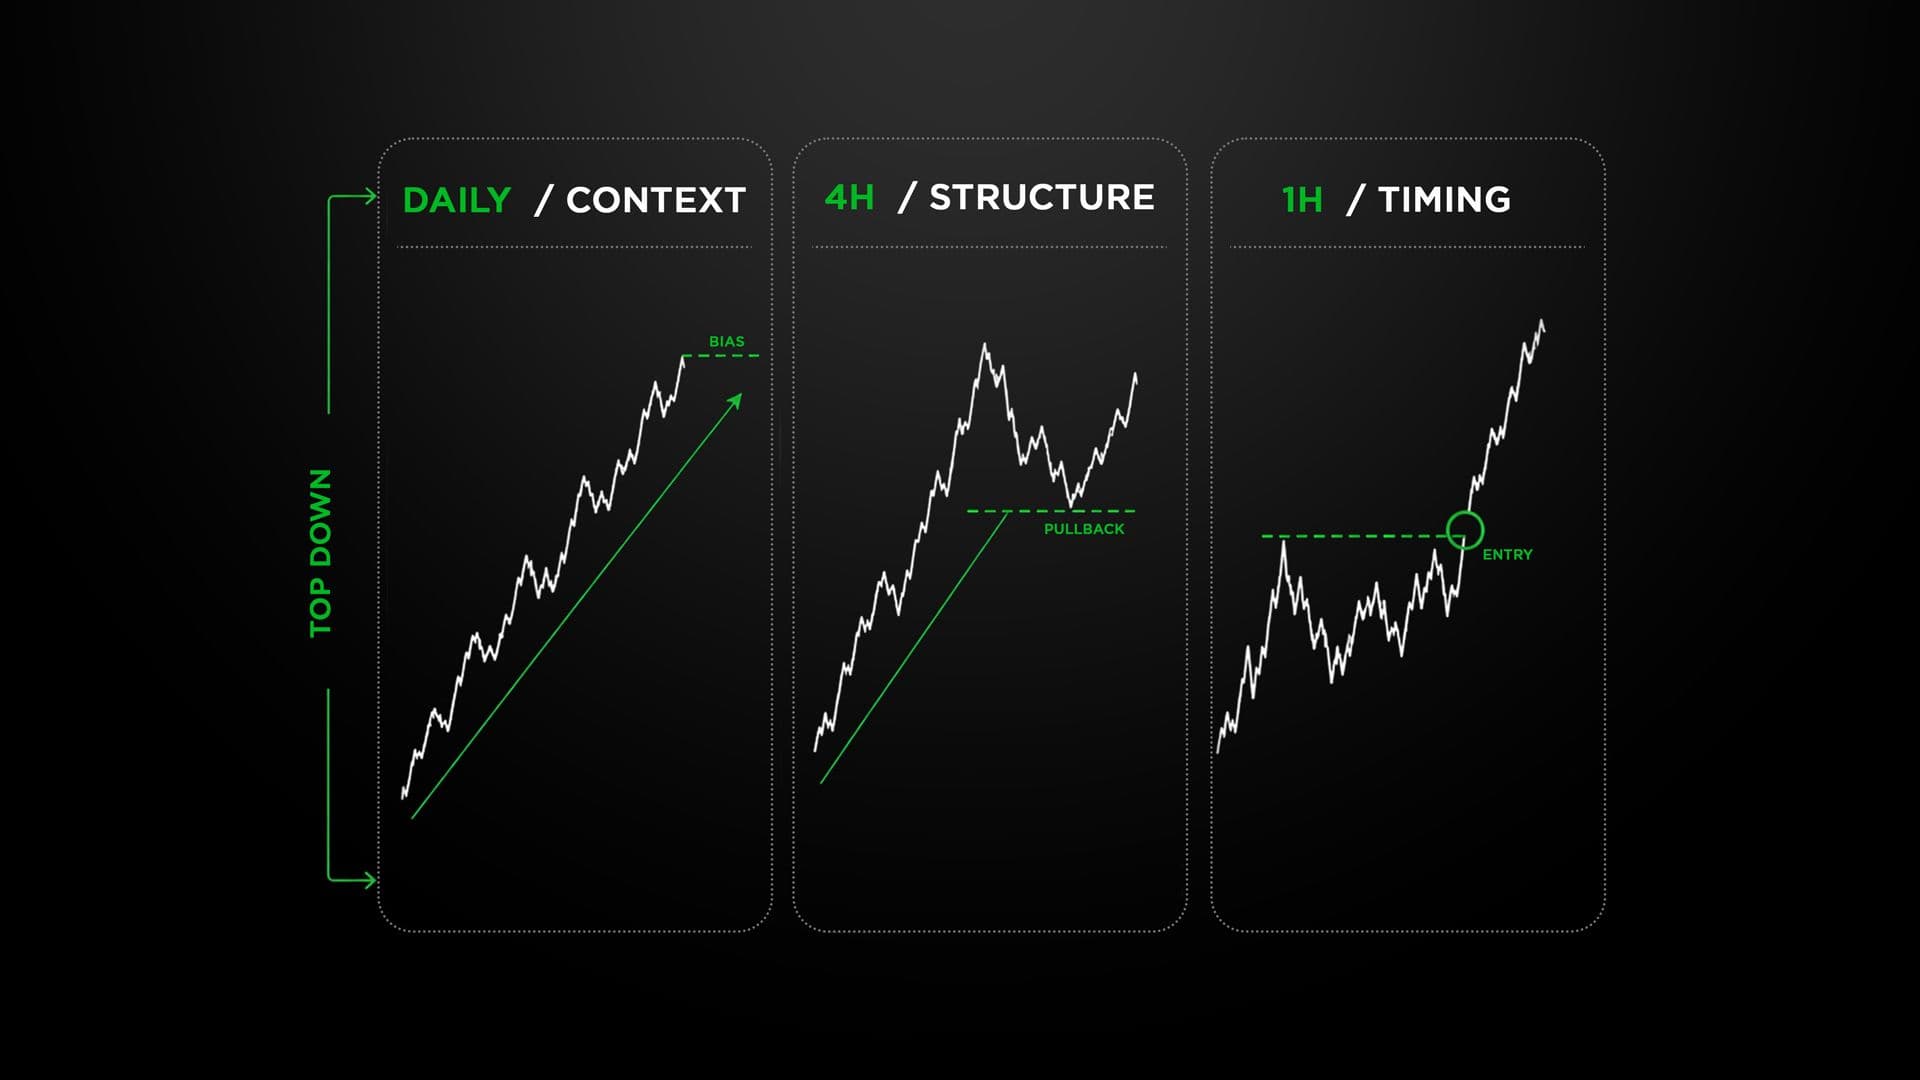
A daily time frame might indicate that prices are trading inside an uptrend. A four-hour time frame might point out that there is a pullback. A one-hour time frame may indicate that prices are trading close to a level where traders watch for confirmation of a breakout.
This creates a hierarchy:
- Higher time frame: Provides broader market context and direction.
- Middle time frame: Helps interpret the current price structure.
- Lower time frame: Can be used to refine entries and manage trade timing.
The exact combination depends on the trader's strategy, holding period, and preferred market.
Why Different time frames Tell Different Stories
Price does not change in one uniform pattern. A market might be trending upwards on the weekly charts but trending downwards on the four-hour charts. Both the statements could be true since they reflect different parts of the same trend.
This is important to understand because a trader might misinterpret a retracement as a reversal of the trend. It may be better to examine the larger picture first.
Different time frames can help traders identify:
- Broader market direction
- Short-term pullbacks and corrections
- Key support and resistance areas
- Potential trend reversals
- The relationship between major and minor price movements
For example, a drop in a shorter time frame could be a typical retracement in a bigger bullish formation. On the other hand, a minor retracement may become more substantial if the support level on a higher time frame is violated.
The benefit of chart comparison is that one should understand the context in which this movement takes place rather than just the direction of candles.
How to Build a Multi time frame Trading Approach
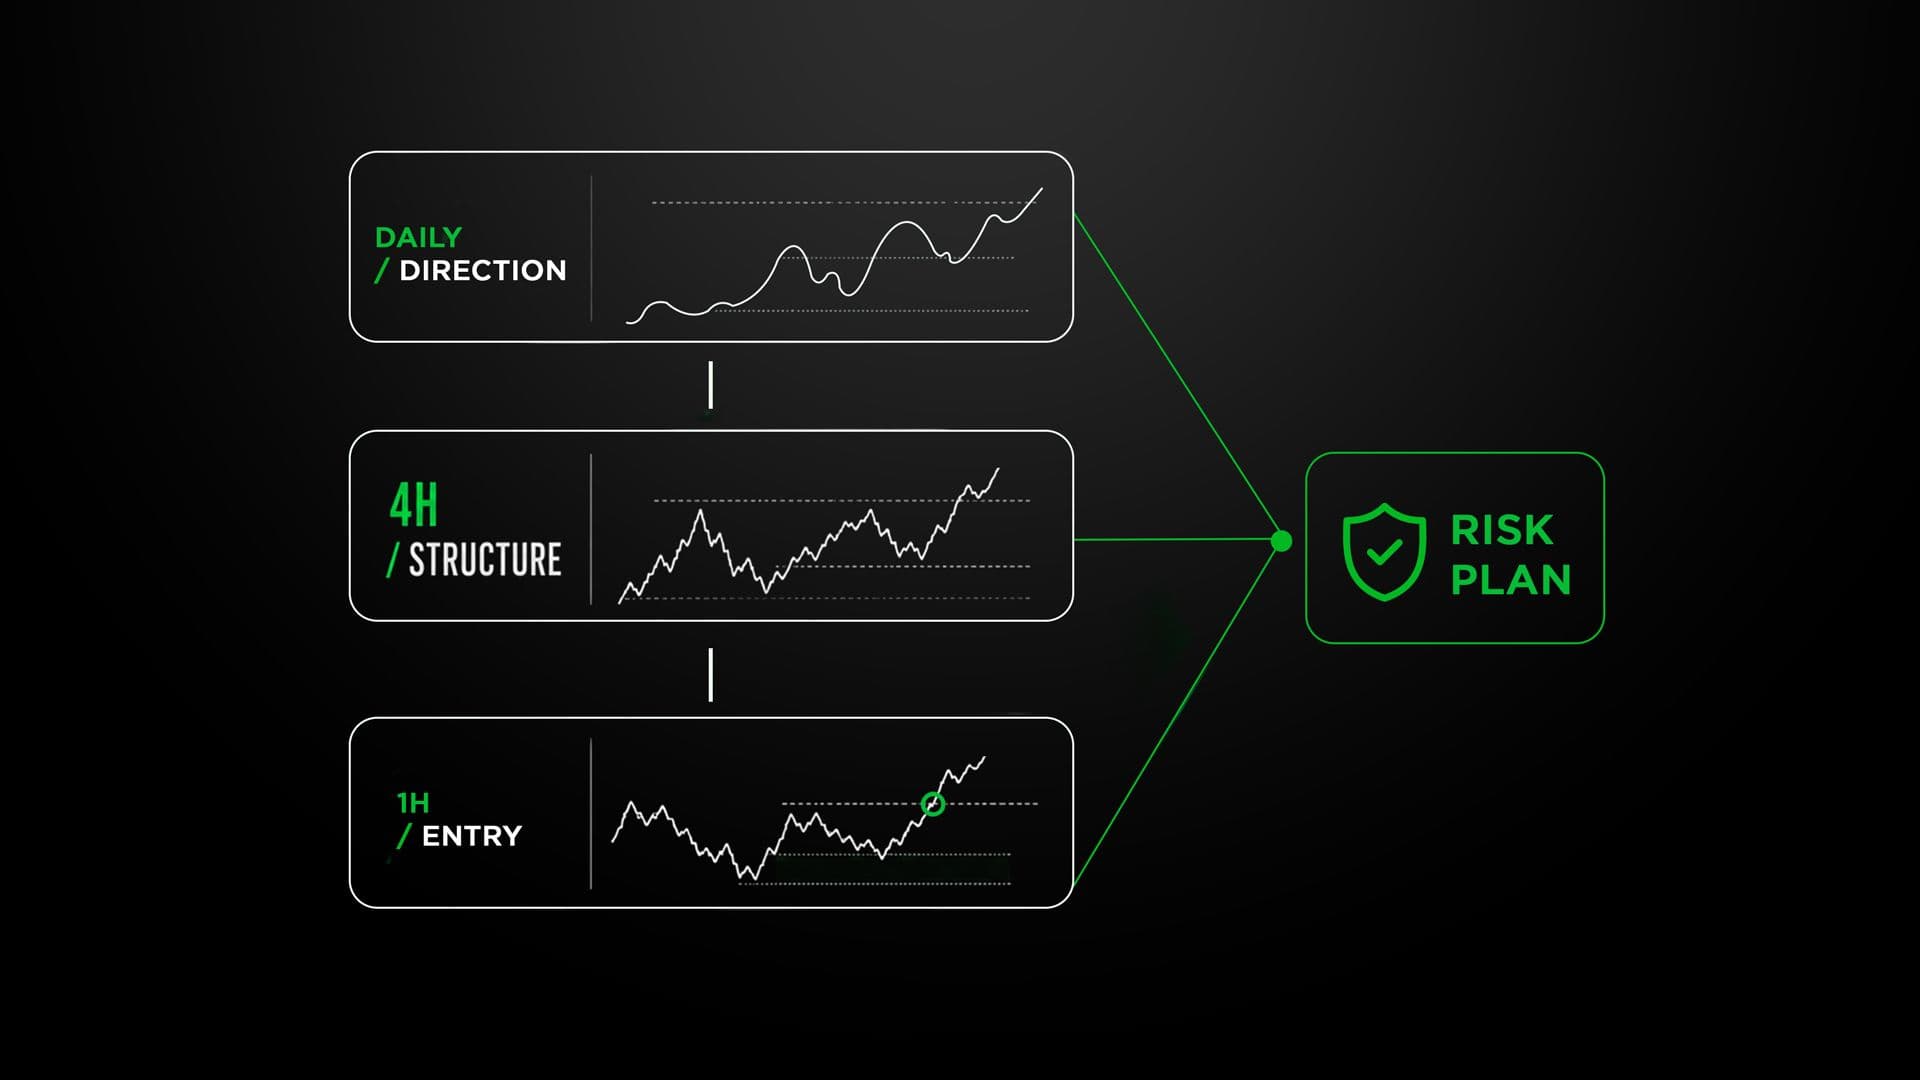
A practical process begins by assigning a clear role to every chart. Using too many intervals can create unnecessary disagreement between signals.
1. Establish the Broader Market Direction
Start with a larger time frame that suits your trading time horizon. Search for significant swing highs, swing lows, support, resistance, and the overall pattern of price.
Your aim should be to set up context and not enter right away.
2. Examine the Intermediate Structure
Now consider the medium term to know what price is doing within the larger context. Find out if the market is trending, consolidating, retracing, or making a breakout from a key level.
This is where the connection between the larger trend and the setup for the trade becomes clear.
3. Refine the Potential Entry
With this lower time frame, traders will now analyze short-term behavior in a specific region of interest. They can analyze either a rejection, breakout, retest, or a short-term structure shift based on their strategies.
The lower time frame will enhance your trade idea without totally eliminating the upper time frame environment.
4. Define Risk Before Entering
If you have figured out where the entry zone is, then the next thing is to figure out when the strategy stops working. Size of position depends on the risk rather than on putting a stop loss at an arbitrary level.
Choosing the Right time frame Combination
There is no universal combination that works for every trader. A day trader may compare hourly, 15-minute, and five-minute charts, whereas a swing trader might use weekly, daily, and four-hour intervals.
The important factor is the relationship between the charts.
| Trading Style | Context time frame | Setup time frame | Entry time frame | Main Purpose |
|---|---|---|---|---|
| Scalping | 15-minute | 5-minute | 1-minute | Short-term execution |
| Day trading | 4-hour | 1-hour | 15-minute | Intraday structure |
| Swing trading | Weekly | Daily | 4-hour | Multi-day moves |
| Position trading | Monthly | Weekly | Daily | Longer market cycles |
These combinations are examples rather than fixed rules. Traders should test their chosen intervals against historical data and their own execution style.
Using Multiple time frame Trading Without Overcomplicating Charts
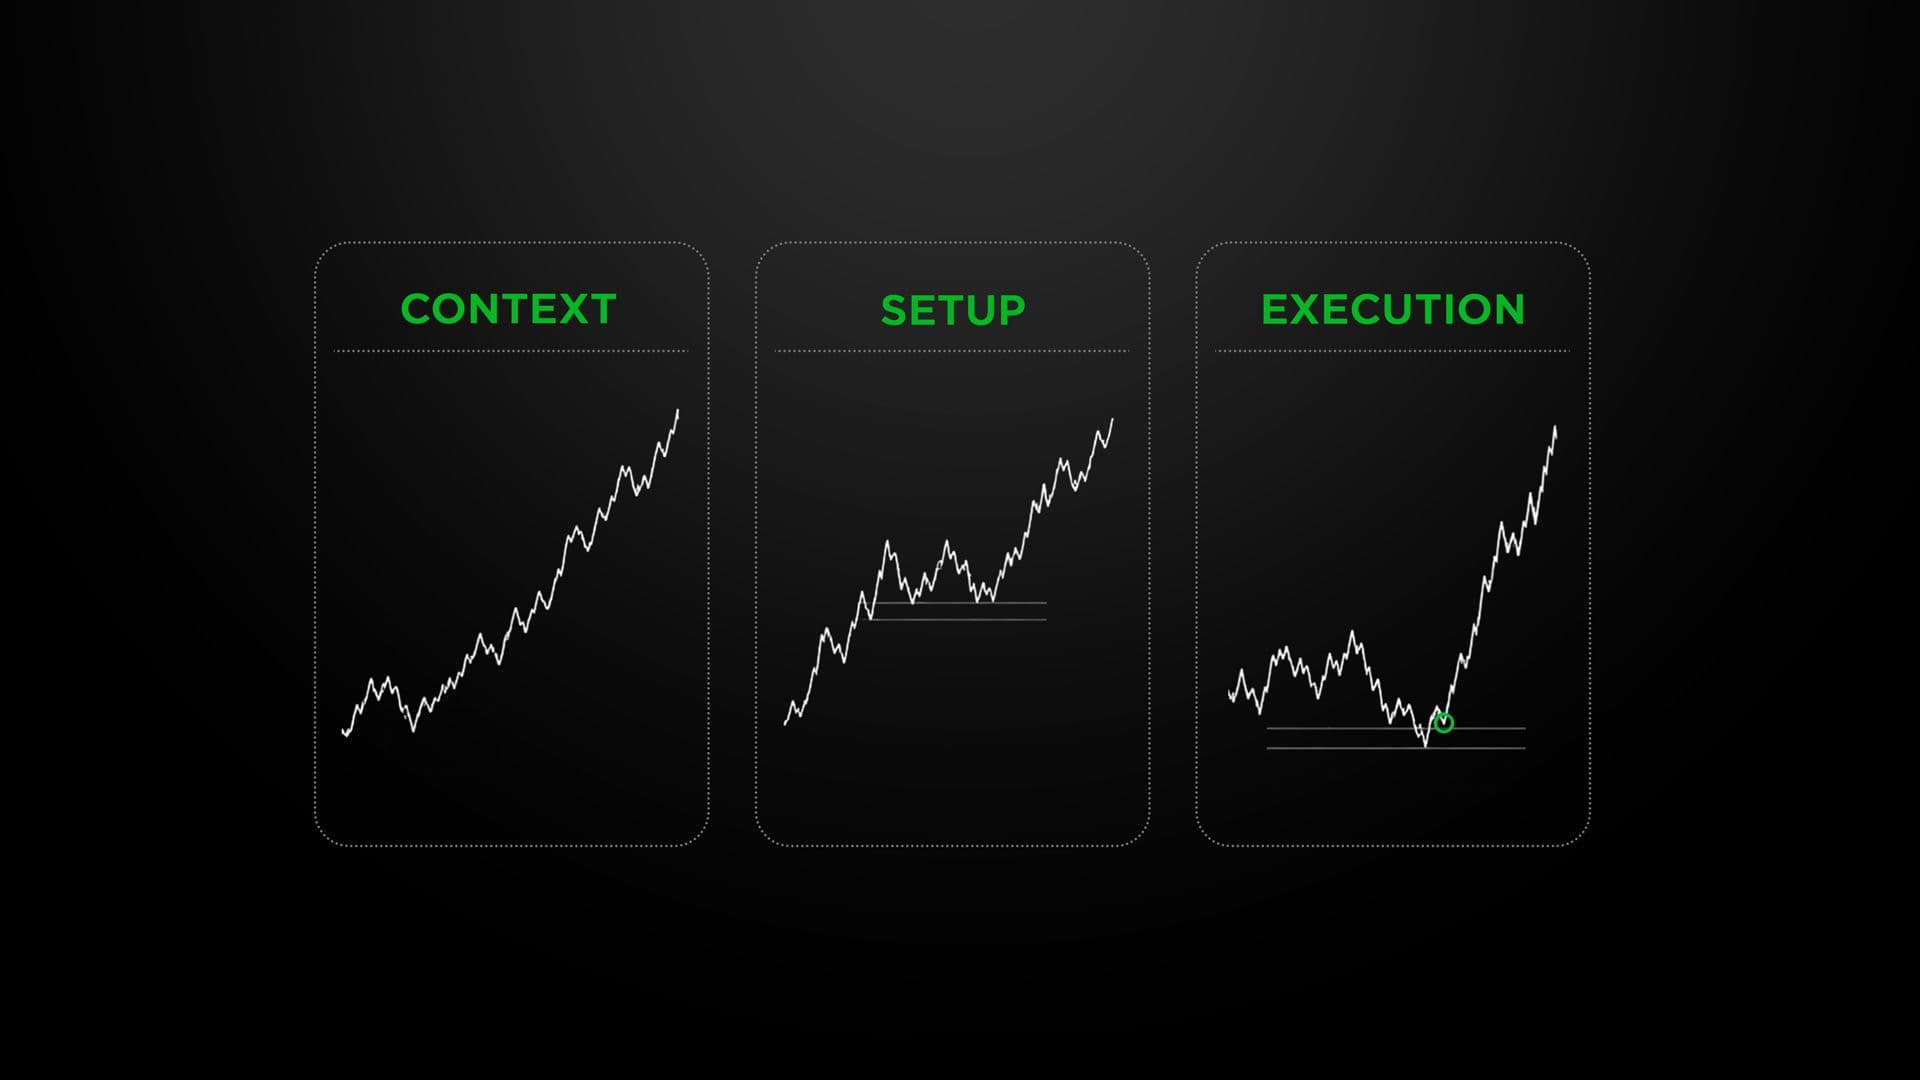
Multiple time frame trading becomes less useful when every available chart is treated as equally important. Five or six intervals may produce numerous interpretations without improving the underlying decision.
A better approach is to create a simple hierarchy. For example:
Context → Setup → Execution
The context chart tells us where the market stands. The setup chart determines if the conditions are forming. The execution chart will help us decide when we can trade.
Such a segregation avoids an unnecessary interference of a smaller time frame move on a well-formed bigger time frame setup.
It is also useful to apply the same analysis method to all your charts. If you are analyzing the market structure, then analyze the structure without altering the indicators or rules for each time frame.
A Simple Example
Imagine an asset has been trending upward on the daily chart and approaches a previously respected support region.
A trader can use the different time frames to evaluate the setup:
- Daily chart: Establishes the broader bullish context and identifies the key support region.
- Four-hour chart: Shows the corrective decline and helps define the developing setup.
- Lower time frame: Provides an opportunity to watch for confirmation and plan the entry.
- Support failure: Signals that the original trade thesis may no longer be valid.
From the perspective of the four-hour chart, the price starts moving into a correction towards that region. Rather than entering a trade straight away, a trader can shift to the lower time frame and check whether the sellers are losing momentum.
In case the lower time frame gives a good enough confirmation based on the rules defined by the trader, the trade may become viable. The higher time frame provides the context, the medium time frame clarifies the set up, and the lower time frame helps in execution of the trade.
If the support level breaks decisively, the initial idea behind the trade may not be valid anymore.
This is how the coordination of the charts helps a trader make the right decision.
Time frame Analysis and Market Structure
The usefulness of time frame analysis increases when this concept is applied to market structure. The trader doesn’t have to ask whether an indicator produces the same signal everywhere, but instead analyzes price action and its formation of proper highs and lows on various time frames.
A larger time frame can form higher highs and higher lows. Then, a corrective move on a smaller time frame can be analyzed against this structure.
Structure should not be applied too rigidly. The market can move from trend to range and vice versa, and one break doesn’t necessarily mean a permanent reversal of the trend. Instead of looking at one candlestick or price action, one should take into account where it happened.
Common Mistakes Traders Make
Using multiple time frames can provide a clearer view of market conditions, but only when each chart has a defined purpose. Without a consistent approach, traders can become overwhelmed by conflicting signals or excessive short-term noise.
The following are some of the most common mistakes to avoid when applying multi-time frame analysis.
- Treating every chart as a separate signal
- Starting with the lowest time frame
- Changing time frames to find confirmation
- Ignoring risk because the setup looks strong
Benefits and Limitations
A structured multi-time frame approach can offer several advantages:
- Provides broader market context.
- Helps distinguish trends from temporary corrections.
- Can improve entry timing.
- Encourages traders to define invalidation levels.
- Reduces dependence on a single chart interval.
But there are certain weaknesses of the approach too. The presence of more charts does not necessarily mean that forecasts will be more accurate. Overanalyzing may result in indecisiveness, controversy, or procrastination.
The technique proves to be highly effective when the trader sets objective goals for each period.
Final Takeaway
Multi time frame analysis approach becomes most useful when there is an understanding of the use for each time frame within the process of making decisions. The upper time frame can provide a context, the middle time frame can provide the unfolding set up, and the low time frame can assist in executing trades.
It is important not to try to reconcile all time frames, since it is normal for the market to generate short term moves that diverge from the major trend. Traders should be able to interpret those short term moves and see if the main trade concept holds true.
With the help of structured chart selection, market structure, entry criteria, and risk control, the trader can treat multiple time frames as information sources rather than conflicting signals.
FAQs
1. What does multi time frame trading mean?
Multitime frame trading involves looking at the same market on several different chart time frames. Every chart time frame is used for a distinct reason like spotting the larger trend, assessing the setup, or perfecting the entry point.
2. How many time frames should a trader use?
There is no requirement for a number. Three charts are used by many traders since it allows for the construction of a useful hierarchy of context, setup, and execution without complicating the analysis.
3. Which time frame is best for trading?
There is no specific best time period. The ideal time period will depend on the strategy of the trader, their holding period, the market, and the capacity to monitor the positions. The swing trader requires a different time period than the scalper.
4. Can different time frames show opposite trends?
Yes. The market could be bullish on the daily chart but bearish on the hourly chart. The short-term fall may be a retracement of the main trend and not necessarily a reversal of the same.
5. Does time frame analysis guarantee better trades?
No. Comparing periods of time can make context and organization clearer, but that will not remove uncertainty from the markets. It is still important to manage risks, test and execute consistently.