Market structure offers a framework to better understand the dynamics of prices in their high-low movements. Rather than examining each candle individually, the trader is able to analyze the relation between price levels in order to know whether the market is trending, ranging, or even reversing.
This method is much more efficient when it comes to analyzing charts because it allows you to see the bigger picture, in terms of the dynamics of buyers and sellers. If there are higher-highs, that might be a sign of bullish price movement, and lower-highs and lower-lows would imply bearish dynamics.
In this blog you will learn about the market structure and how to use it to read the price actions and identify the right trends.
What Is Market Structure?
Market structure refers to how the price is structured using the swing highs and lows. This process results in an observable sequence that traders can use to understand the current condition of a market.
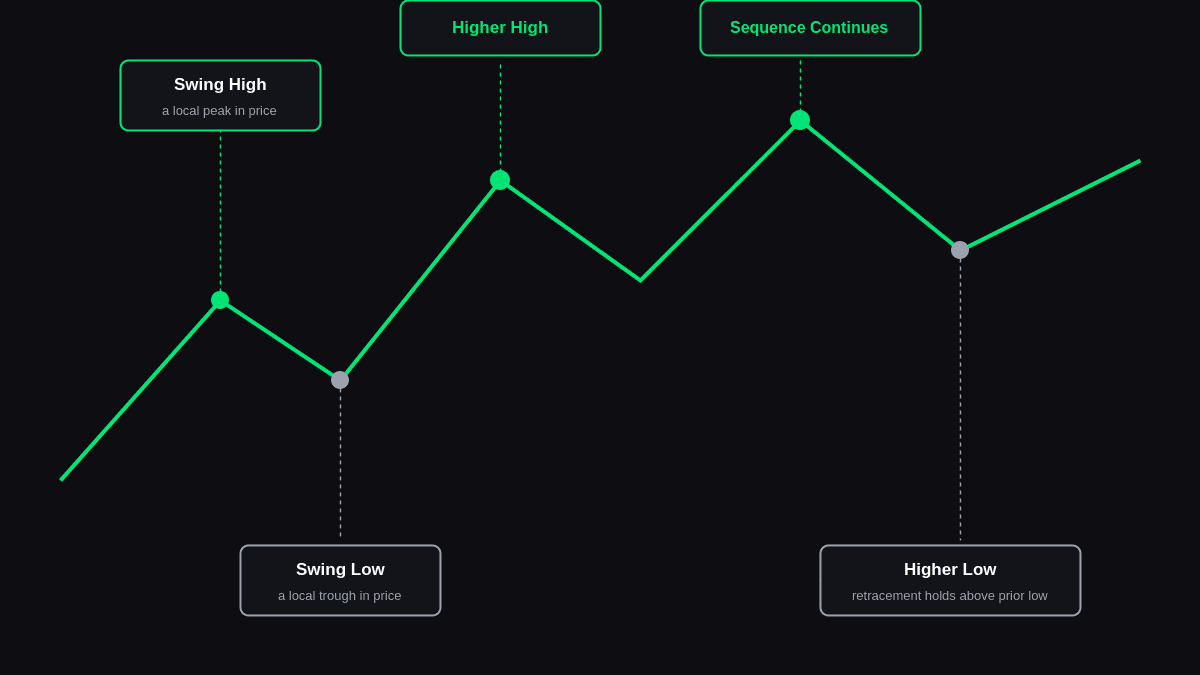
The main structural patterns include:
- Bullish structure: Price generally forms higher highs and higher lows.
- Bearish structure: Price tends to create lower highs and lower lows.
- Range-bound structure: Price moves sideways when neither buyers nor sellers maintain clear directional control.
The key thing to remember is that structure is defined in terms of price relationships and not one single candle. While a sudden move might catch one’s eye, it can only be understood in relation to past swing points.
This is how structural analysis helps create a context for the setup analysis.
The Three Core Market Conditions
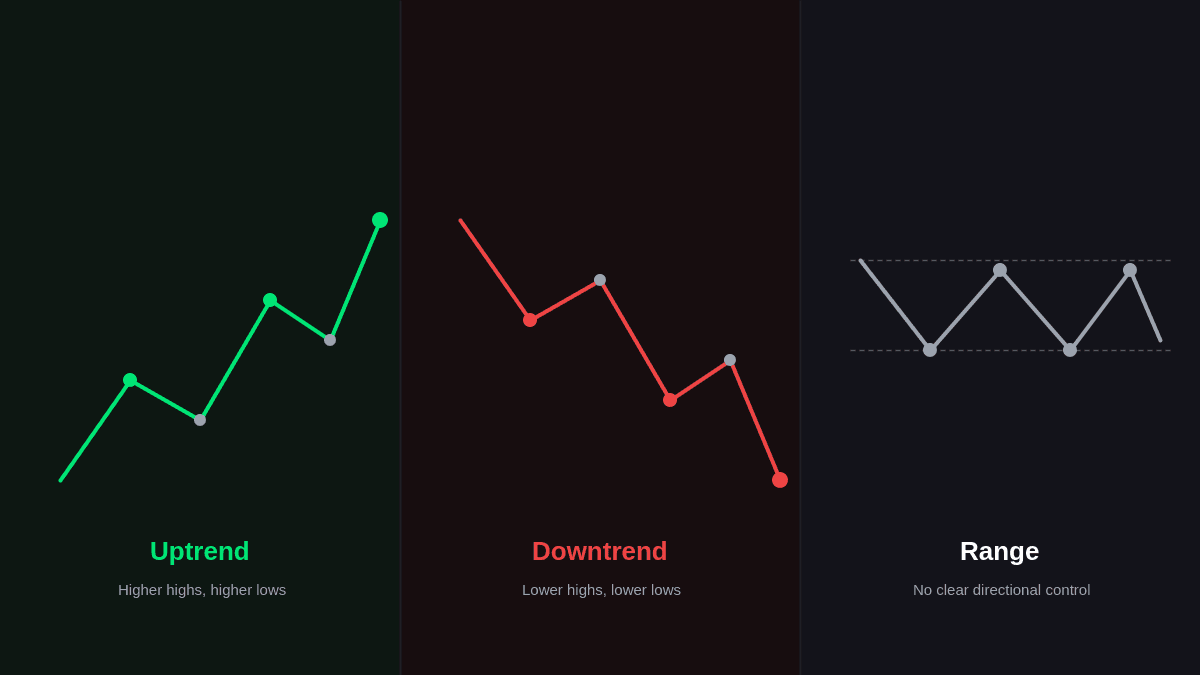
Markets do not move in one direction indefinitely. Price can trend upward, trend downward, or spend extended periods moving sideways. Here you can explore the three core market conditions:
Uptrend Structure
Uptrend is usually spotted through a series of higher highs and higher lows. The price gets pulled up to new highs by the buyers, and then comes a retracement that stays above critical lows.
The retracement does not always mean the end of the trend. If the overall pattern continues, then the retracement is just the weakness of the current trend.
Downtrend Structure
A downtrend typically forms with lower highs and lower lows. The sellers consistently take prices to lower levels, and all recovery efforts are unable to breach past key high levels.
An uptick within an existing downtrend doesn’t necessarily mean that the bearish condition no longer exists. One needs to look at the entire pattern before concluding so.
Range-Bound Structure
The ranging market does not have a series of higher-highs or lower-lows. Rather, price action is characterized by repeated movements in a defined area of highs and lows.
In this type of trading environment, trend analysis becomes difficult as both the buyers and sellers fail to gain control over the price action.
Market Structure vs. Other Trading Signals
The structural approach is broader in scope, whereas many other trading systems only analyze certain facets of price action. Understanding the differences ensures that traders do not see each signal or indicator as a stand-alone trading strategy. Rather, market structure could be used to supply the broader context of those signals.
| Tool or concept | Primary purpose |
|---|---|
| Market structure | Understand the organization and direction of price movement |
| Support and resistance | Identify areas where price may react |
| Candlestick patterns | Examine short-term buying and selling behavior |
| Moving averages | Smooth price data and highlight potential trends |
| Momentum indicators | Assess the speed or strength of price movement |
While these techniques can work together, they are not the same as each other. For instance, a bullish candlestick formation might show up at a certain price point, but the underlying structure is useful in establishing whether the signal is found in an existing uptrend, downtrend, or range.
It is in this way that structure can assist in avoiding relying too much on a single signal for trading.
How to Read Price Action Using Market Structure
Reading price action through market structure is about detecting relevant highs, lows, and the relationship between them. Traders don't need to respond to each small fluctuation but rather utilize market structure to determine whether buyers or sellers have more control at that moment.
Here you can find a proper guide to read price actions:
Start With the Higher Timeframe
Start off with a larger time frame in order to determine the general direction first before moving on to analyze smaller price movements.
Identify Significant Swing Highs and Lows
Identify those prices where you notice some reaction. Don’t go into small reactions but only significant ones since marking too many can clutter your chart.
Determine the Current Price Direction
Compare the swing points identified to determine if price is showing higher highs and higher lows, lower highs and lower lows, or lacks any pattern at all.
Watch for Changes in the Existing Structure
If this trend pattern is set up, then you should see if there are significant turning points in place. This might suggest that the prevailing trend is breaking down or moving to another state.
Market Structure Trading in Different Market Conditions
Before understanding how to use it to identify trends using market structure, it is better to understand how market structure trading works across different market conditions. Market structure trading requires traders to interpret price behavior according to the environment in which it occurs.
Below, you will find a clear comparison to understand how market structure can behave in different market conditions.
| Market condition | Typical structure | What traders may examine |
|---|---|---|
| Strong uptrend | Higher highs and higher lows | Whether pullbacks preserve important lows |
| Strong downtrend | Lower highs and lower lows | Whether recoveries remain below key highs |
| Consolidation | Repeated movement within a range | Reactions around range boundaries |
| Transition | Existing sequence begins to weaken | Structural breaks and failed continuation |
| High volatility | Large and rapid swings | Whether apparent breaks remain valid |
This means that the same price action will have varying significance depending on the different conditions. Price breaking out above a prior high in an uptrend is supportive of continuation, whereas the same price action in a range could only be seen as a breakout before reverting to the midline of the range.
Identifying the surrounding environment will ensure that traders are not analyzing all structured actions in isolation.
How to Identify Trends Using Market Structure
To identify a trend using market structure, examine the sequence of significant swing highs and swing lows rather than focusing on individual candles. The relationship between these points can reveal whether buyers or sellers are maintaining control.
1. Look for Higher Highs and Higher Lows
An uptrend is created by price making higher highs and higher lows. Each new high is above the previous high, whereas pullbacks are above prior swing lows.
2. Look for Lower Highs and Lower Lows
Downtrends form based on the lower high and lower low structure. The price is unable to surpass the old swing highs and only continues forming lower lows.
3. Check for Sideways Price Movement
In case the price bounces around a high and low in such a way that it does not establish a regular trend, then this can be considered to be a range-bound market where there may not be a clear trend.
4. Compare Different Timeframes
A lower timeframe trend can be an indication of a higher timeframe trend going in the opposite direction. Examining the higher timeframe is an important tool that will assist in understanding whether the trend is the overall market trend or just a temporary one.
5. Watch for a Change in Structure
Trends may become weak when the price is unable to sustain the prevailing order of things. This could happen when an uptrend is broken by a failure to break an important higher low, and a downtrend may be weakened by a failed lower high.
Common Mistakes When Reading Price Structure
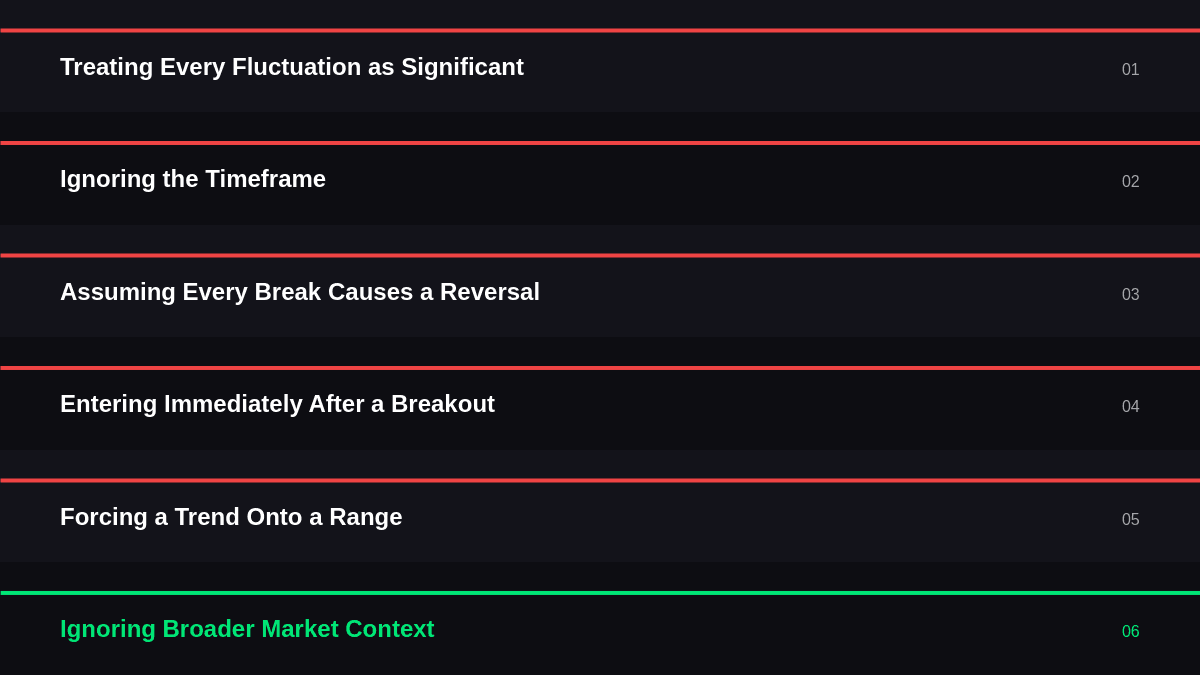
Reading price structure effectively requires attention to context, timeframe, and the significance of individual price movements. Avoiding common errors can help traders interpret structural changes more objectively and reduce misleading conclusions.
- Treating every fluctuation as significant
- Ignoring the timeframe
- Assuming every break causes a reversal
- Entering immediately after a breakout
- Forcing a trend onto a range
- Ignoring broader market context
Final Thoughts
Market structure offers traders a practical way to analyze how price is unfolding rather than trying to base the analysis purely on signals. By observing significant highs and lows, traders will be able to identify the direction of the trend, the difference between ranges and trends, and detect changes in an existing pattern.
The power of structural analysis lies in its ability to consider the context of a particular price move. In an ongoing powerful trend, a new high will have a different meaning compared to the one observed within a choppy range. Furthermore, breaking out of a key level does not always mean a reversal.
Thus, traders need to be trained to spot such structural patterns on historical charts under various conditions.