Key levels are essential price zones, which can affect how traders perceive market dynamics. As price gets close to any of these zones, buyers and sellers behave in different ways, triggering reactions like reversal, consolidation, breakout, or retest. Understanding these key levels can assist traders in organizing analysis rather than just responding to every price movement.
These key levels do not predict the exact behavior of the market. The idea is simply to provide some context about possibly important zones and analyze what the market does upon reaching them. By considering these zones in addition to market structure, confirmation, and risk management, traders make more thoughtful decisions.
In this blog you will explore the key levels that can help you shape the price action and trading decisions.
What Are Key Levels in Trading?
Key levels are important areas where price action has previously been significantly affected or where present market conditions indicate that price could get affected at these levels. Levels could form from previous highs or lows, trading ranges, psychologically important levels, or levels which have historically played an important part in price action.
A level should not always be seen as an exact price. In most cases, it would make more sense to treat it as a price zone where buyers and sellers fight each other.
Why Key Levels Matter to Price Action
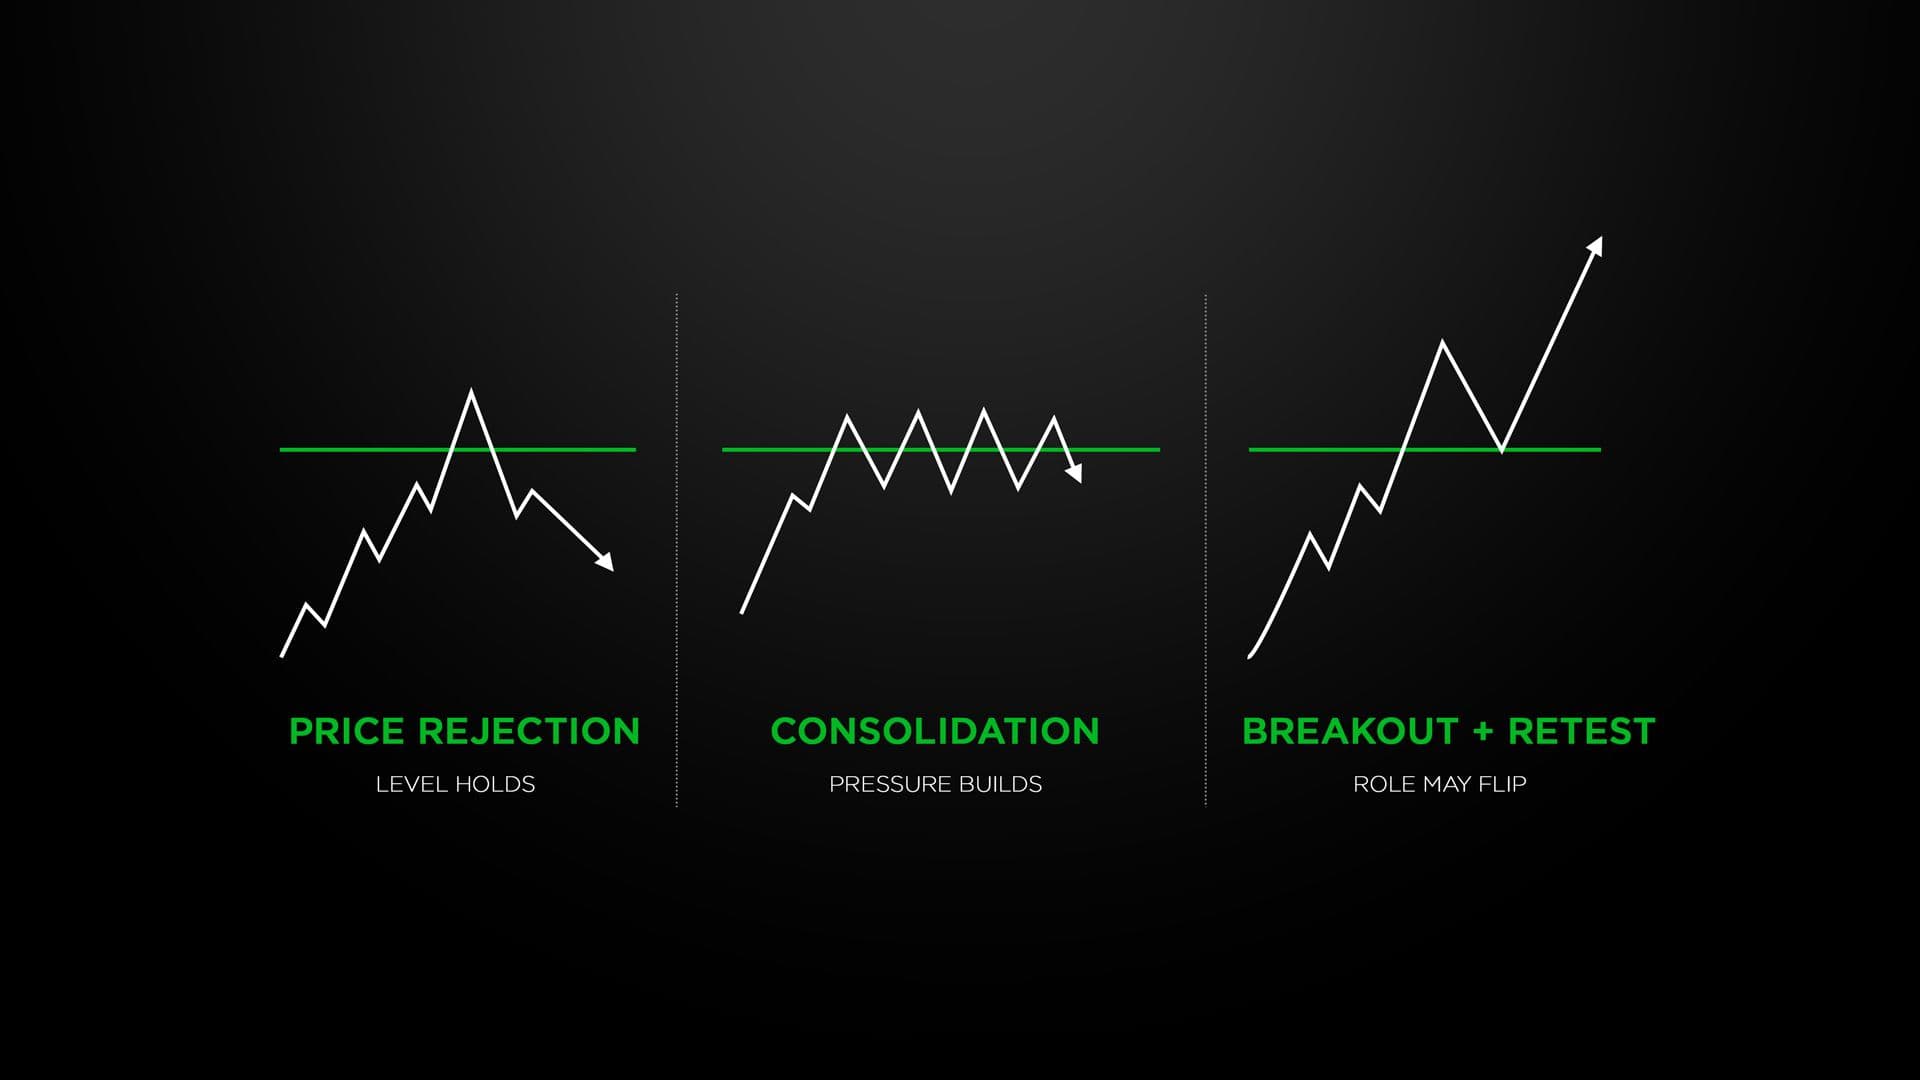
The price action may change when it gets to an area where traders are paying attention. The market can ignore it, hesitate at it, or break it decisively.
This can be useful information for traders trying to gauge if there is increasing buying or selling pressure.
Price Rejection
A rejection is formed when the price moves to a certain zone and fails to move further in its direction. For instance, rejection at a previously touched high could signal that the sellers have become active in this zone.
Nevertheless, the rejection pattern alone is not sufficient for reversal confirmation. The trader may wait for some time until other elements form.
Consolidation Near a Level
At times, the price does not deviate instantly from the significant level but rather stays near to it. In such cases, a temporary equilibrium can be achieved between the two groups.
An enlargement from such a consolidation will then give us information on the dominant group.
Breakout and Retest
A move through an already familiar area could lead to the reinterpretation of that price level. Resistance levels can act as support and support levels can become resistance levels once a breakdown occurs.
This kind of action is especially pertinent to breakout trading because here, traders need to evaluate whether price can stay outside the already familiar boundaries.
Types of Key Levels Traders Watch
Different sources can create significant price areas. Recognizing their origin helps traders understand why a particular zone may deserve attention.
Previous Swing Highs and Lows
Past swings represent previous places where there has been a reversal in the price direction. The trader can use these swing points whenever price action reaches these points in the future because they can be areas of continuation, rejection, or liquidity reaction.
Support and Resistance Levels
Support and resistance levels are the areas where the price was faced with buying or selling pressure before. Support is usually referred to the area where the price faced demand in a downward direction while resistance is the area where the price faced supply upwards.
Repeated reactions can make these areas more useful for analysis than isolated price points.
Psychological Price Areas
Round figures tend to catch people’s eye since they are easily noticeable by traders. In certain cases, values like 100, 500, or 1,000 can attain psychological significance.
These areas should still be evaluated alongside actual price behavior rather than treated as automatic turning points.
Trading Range Boundaries
If price action occurs within an identified range between certain highs and lows, then the highs and lows themselves could be considered key reference levels for traders to observe.
How to Identify Strong Key Levels
Not every visible price point deserves to be marked. Too many levels can make a chart difficult to interpret and reduce the usefulness of the analysis.
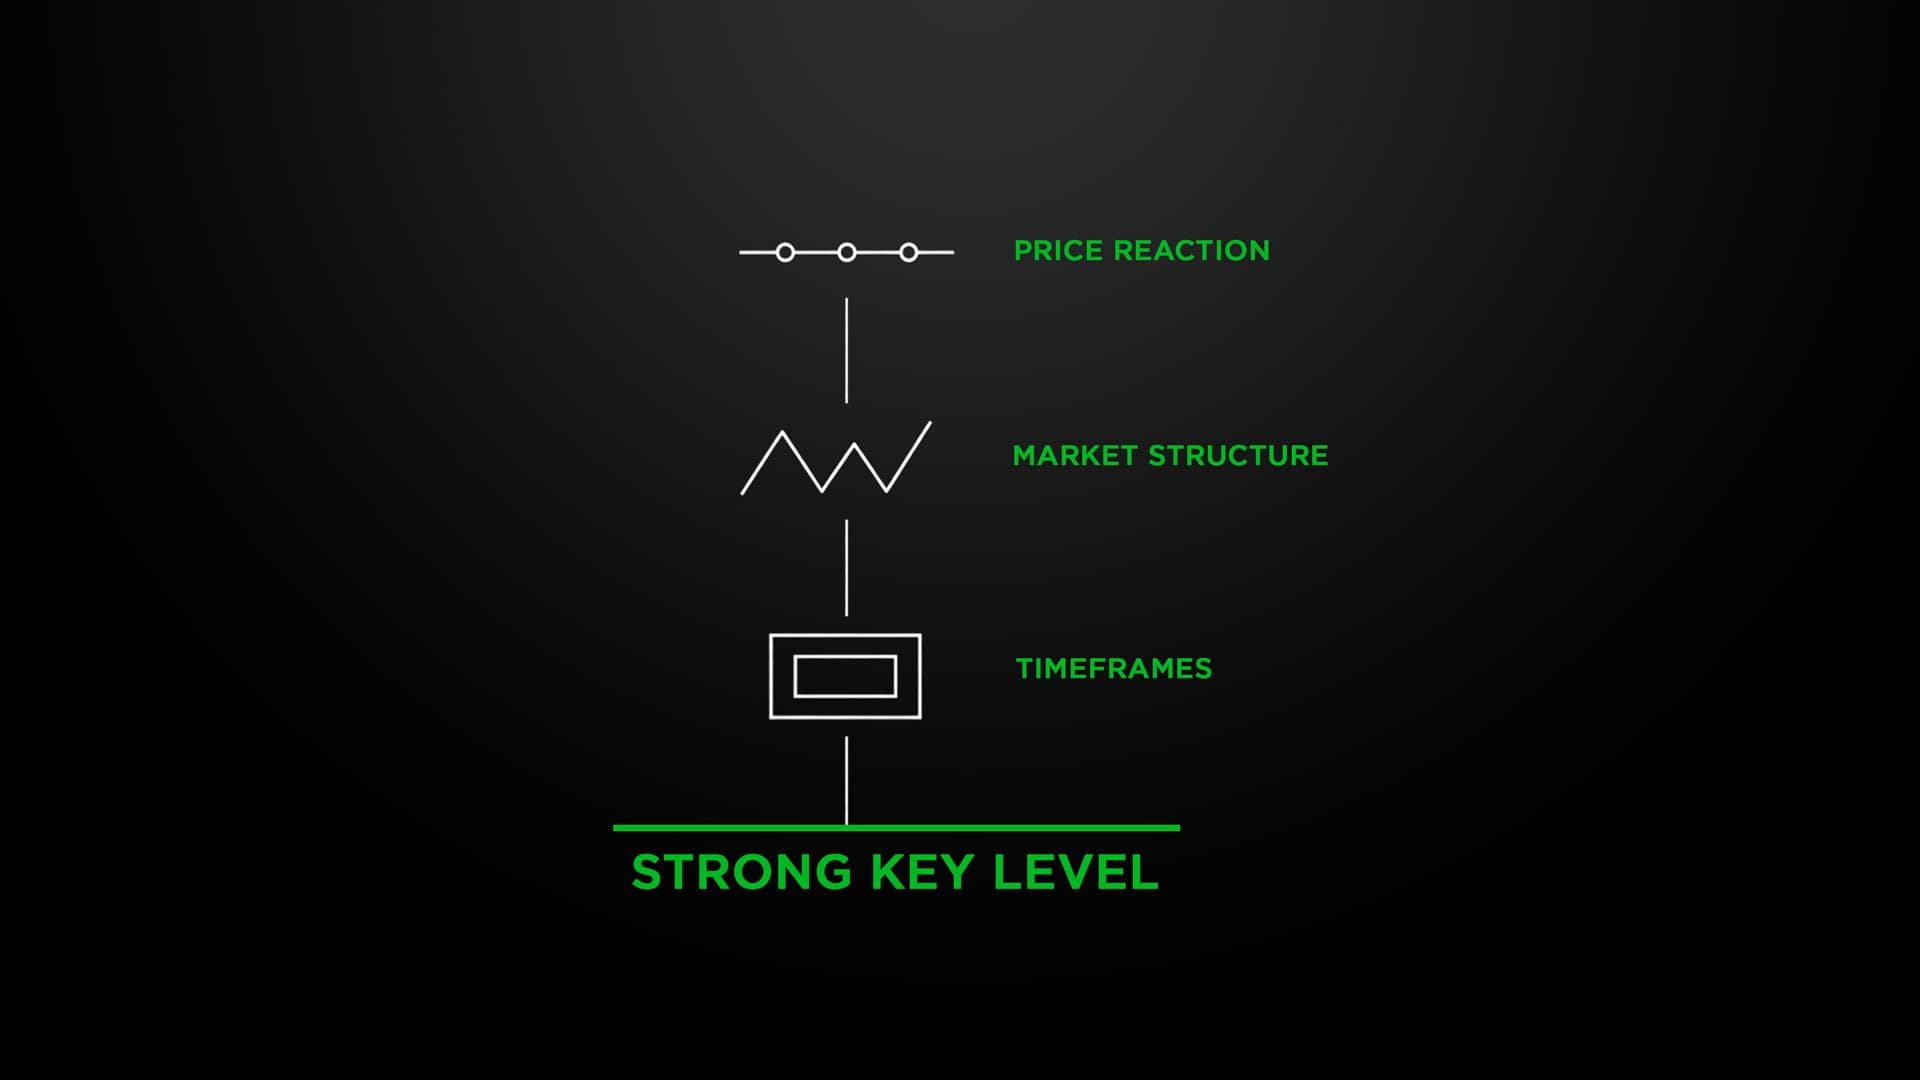
1: Review Historical Price Reactions
Look for areas where price previously reversed, paused, or accelerated. Multiple meaningful reactions can provide stronger evidence that an area has influenced market behavior.
2: Study the Broader Structure
It is essential to view a level in terms of the general market condition. A resistance zone in an up trend would behave differently from a resistance zone in a down trend.
Having knowledge of the prevailing conditions would help avoid attaching too much significance to levels in isolation.
3: Compare Multiple Timeframes
Higher timeframe charts can help spot important structural levels that might not be apparent on lower timeframes. Lower timeframes can then be analyzed to see how price reacts at such bigger levels.
This approach can help separate major areas from minor intraday fluctuations.
How Traders Use Key Levels for Decisions
Identifying a level is only the beginning. The more important question is how price behaves when it reaches that area.
Establish the Market Context
First of all, identify whether the market is in an uptrend, downtrend, range-bound, or a period of structural change. This will provide context for the interpretation.
Wait for Confirmation
Traders may enter not on the basis of price having reached a certain level but on signals like rejection, structural change, breakout, or retest.
It should be noted that confirmation does not remove all doubt, but it avoids traders from making decisions based only on the price level.
Define Entry and Invalidation
If a possible setup occurs, the trader then knows what the parameters would be for entering the trade and what price action would disprove the setup.
This results in there being a clear difference between a setup and market movement that disproves the initial premise.
Assess Risk and Potential Reward
Even when a reaction occurs on a significant level, it could still result in a bad trade if the possible gain does not warrant the risk. Traders must consider the following before placing their trades:
Key Levels in Price Action Trading
In most cases, price action trading will depend a lot on major areas since one can analyze how prices move without necessarily using technical indicators.
For example, a trader may spot a resistance area, watch how price moves towards the area with waning momentum, and wait for a reaction that is bearish to consider a setup.
Key levels can help traders:
- Pinpoint locations where the price could move.
- Assess any change in buying or selling force.
- Confirm first before placing any trade.
- Be able to tell whether it is a reversal or not.
- Create zones for entries, target or invalidation.
The level is where the action takes place, and the price activity gives you proof. This is critical because the level guides you on where to look out for action, and price activity shows you what is happening at that point.
Key Levels vs. Other Price Concepts
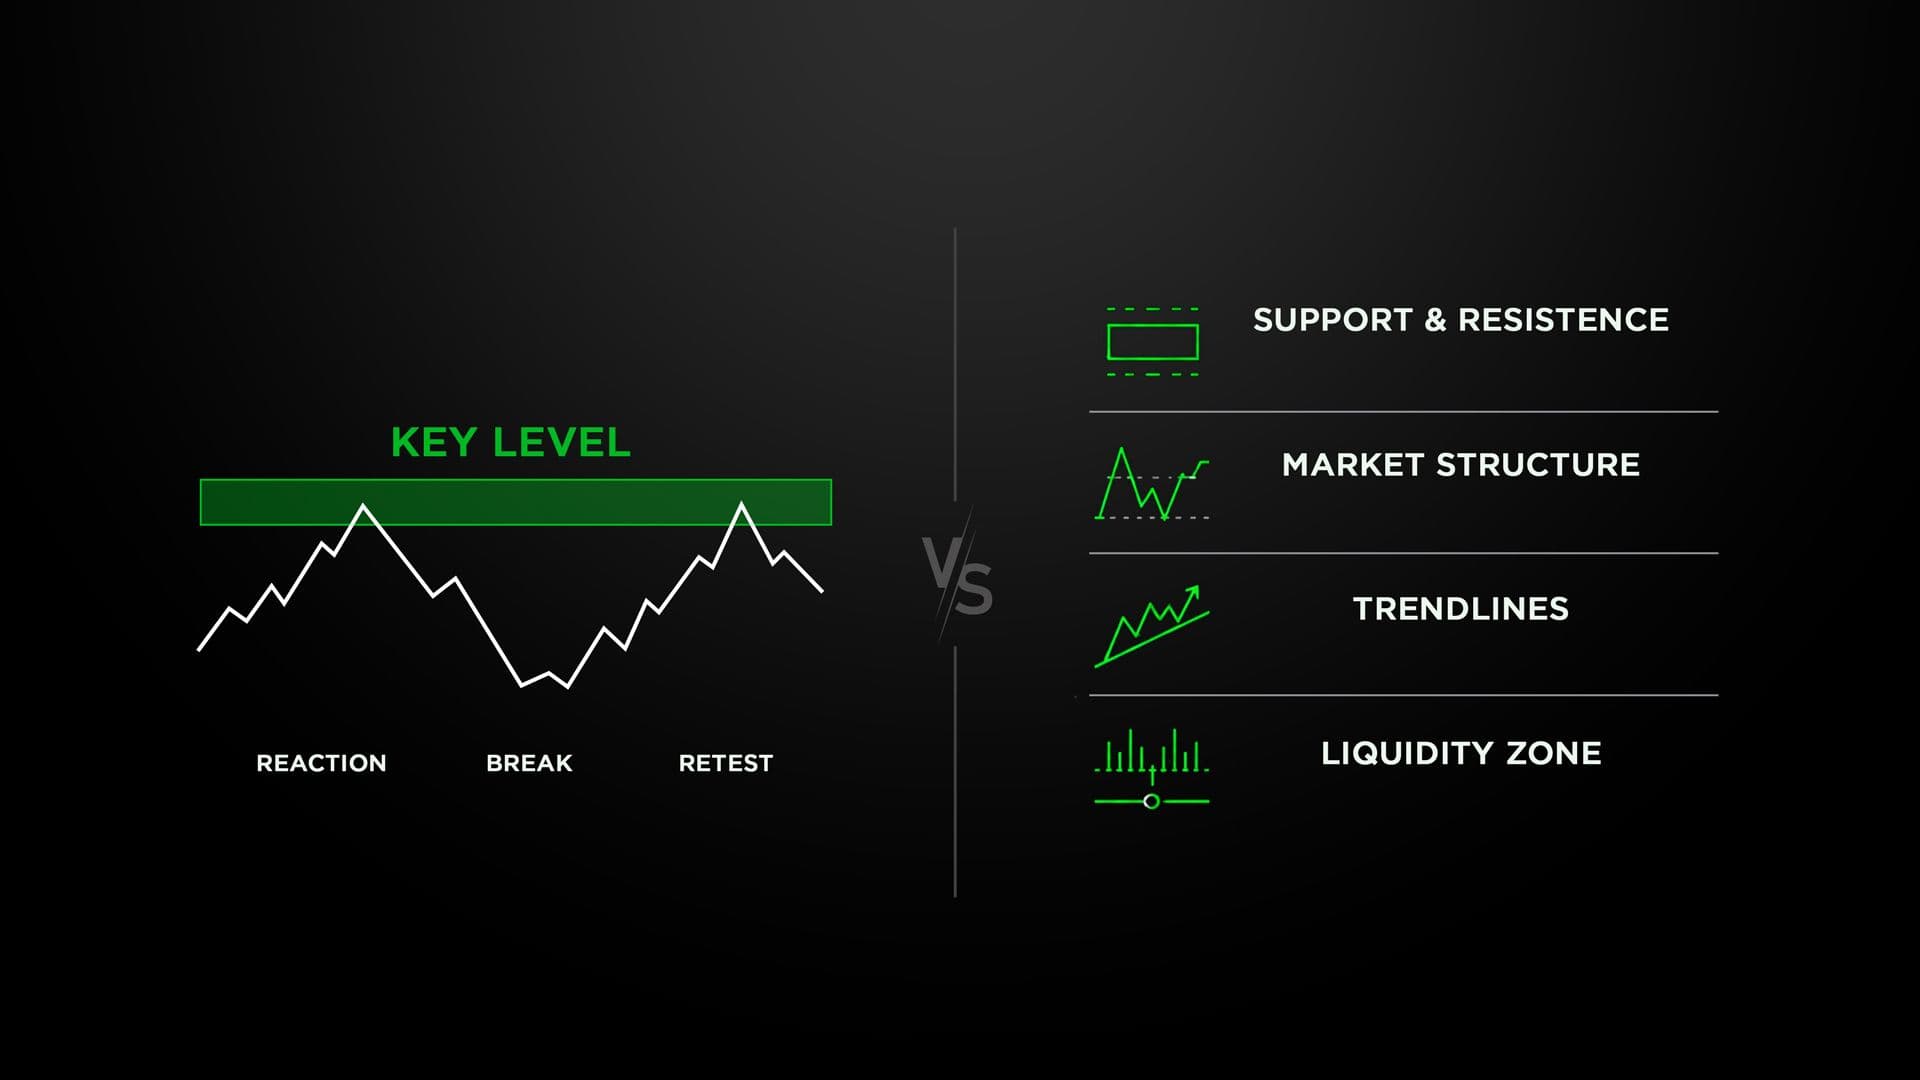
Several key levels are closely associated with certain price action ideas, yet they all have their own functions and purposes when applied to the market. This is why knowing the difference between them will help traders find the right tool to analyze price action.
Traders should not use these ideas synonymously; instead, traders can use them altogether.
| Concept | Primary Role | What Traders Analyze |
|---|---|---|
| Key levels | Highlight significant price areas | Reactions, breaks, and retests |
| Support and resistance | Identify recurring demand and supply areas | Previous reactions |
| Market structure | Define directional behavior | Highs, lows, and structural shifts |
| Trendlines | Track directional movement | Dynamic areas of support or resistance |
| Liquidity zones | Highlight areas where orders may cluster | Sweeps and reactions |
These concepts can work together, but they are not identical. Each provides a different perspective on market behavior.
A Practical Process for Analyzing Key Levels
A consistent workflow can make level-based analysis easier to apply.
1. Start With the Higher Timeframe
Determine the important highs, lows, ranges, and structure regions before focusing on the finer price details.
2. Narrow Down the Important Zones
Remove insignificant levels that lack any historical significance. Only use the levels that can truly affect your decision to trade.
3. Wait for Price to Reach the Area
Do not develop your strategy on the basis of a level before the market comes into contact with that level.
4. Analyze the Reaction
Search for indications of rejection, consolidation, momentum, structural shifts, or the confirmed breakout. Check if the behavior backs up your initial market hypothesis.
5. Define the Trade Conditions
Establish entry, invalidate, and target conditions before you act. This will prevent you from making impulsive decisions during price fluctuations.
6. Review the Outcome
When the trade or setup is complete, analyze whether the level worked as predicted and whether your analysis was in keeping with the original principles.
Common Mistakes When Using Key Levels
Using too many levels or treating them as guaranteed signals can weaken an otherwise useful trading process.
- Marking every visible swing: Too many levels can create unnecessary chart clutter.
- Treating levels as exact lines: Price often reacts within a zone rather than at one precise number.
- Entering without confirmation: Reaching a level does not automatically validate a trade.
- Ignoring market structure: A local reaction may have little significance against the broader trend.
- Assuming every breakout will continue: Price can move beyond a level and quickly return to the previous range.
- Changing risk rules after entry: Adjusting invalidation simply to avoid a loss can undermine the original setup.
Conclusion
Key levels give traders an opportunity to have an idea about where the price is likely to face a change in buying/selling pressure. The value of these levels lies in the combination of the placement of the level with the market structure and what happens around it.
In other words, one does not necessarily need to rely on the idea that a particular level will lead to a reversal or breakout. With patience and proper evaluation of risks, one can make these levels become a part of the decision-making process.
Frequently Asked Questions
Are key levels always exact prices?
No. Many significant areas are better treated as zones because price can move slightly beyond a level before reversing or continuing.
How do I know if a key level is important?
Look for meaningful historical reactions, higher-timeframe relevance, repeated tests, and alignment with the broader market structure.
Can key levels be used in any market?
These can be applied to a wide variety of markets and timeframes; however, their accuracy may fluctuate based on factors like liquidity and volatility.
Should I enter a trade as soon as the price reaches a level?
Not always. The waiting period may yield more insight into whether it was the buyers or sellers who were reacting to the area.
Can key levels fail?
Yes. There is no particular level that will automatically result in a reaction. A reaction can occur because of strong momentum, surprise announcements, changes in market conditions, or lack of buying/selling pressure.