Multi Timeframe Analysis involves examining the same market on different chart intervals before making a trading decision.
Instead of evaluating an entry from one chart alone, traders can use different timeframes to understand market structure, assess a setup, and identify a potential entry.
The value of this approach comes from combining different levels of price information without assuming that every chart needs to produce the same signal. A short-term move can occur within a larger trend, so understanding the relationship between timeframes can provide useful context before an entry.
What Is Multi-Timeframe Analysis?
Multi Timeframe Analysis is the practice of analyzing the same asset across two or more chart timeframes.
The number of timeframes and their intervals depend on the trading strategy. A swing trader may use daily, 4-hour, and 1-hour charts, while a shorter-term trader may work with 1-hour, 15-minute, and 5-minute charts.
The key is to assign a clear purpose to each chart rather than using multiple timeframes simply to generate more signals.
| Analysis | Primary purpose |
|---|---|
| Broader view | Understand market structure and major levels |
| Intermediate view | Study the current setup |
| Detailed view | Identify a potential entry condition |
This structure keeps the analysis organized while allowing traders to move from general market conditions toward a specific trade decision.
Why Use Different Timeframes?
Multi Timeframe Trading can add context that may not be visible from a single chart.
Distinguish Trends From Corrections
A market can maintain its broader structure while experiencing short-term movements in the opposite direction. For example, a temporary decline on a lower interval does not automatically mean that a larger uptrend has ended.
Viewing different intervals helps traders assess whether a move represents a continuation, correction, consolidation, or possible structural change.
Identify Significant Price Levels
Important support and resistance areas can become more apparent on broader charts. These levels can then be monitored more closely as price approaches them.
This can help traders distinguish between an entry occurring near a meaningful market area and one occurring in the middle of an otherwise unremarkable price range.
Avoid Isolated Entry Decisions
A lower-timeframe signal can look attractive when viewed on its own. Examining the surrounding market structure provides additional information before deciding whether the setup fits the trading plan.
The framework therefore works best as a context-building process rather than a method for collecting more signals.
How to Build a Multi-Timeframe Entry Strategy
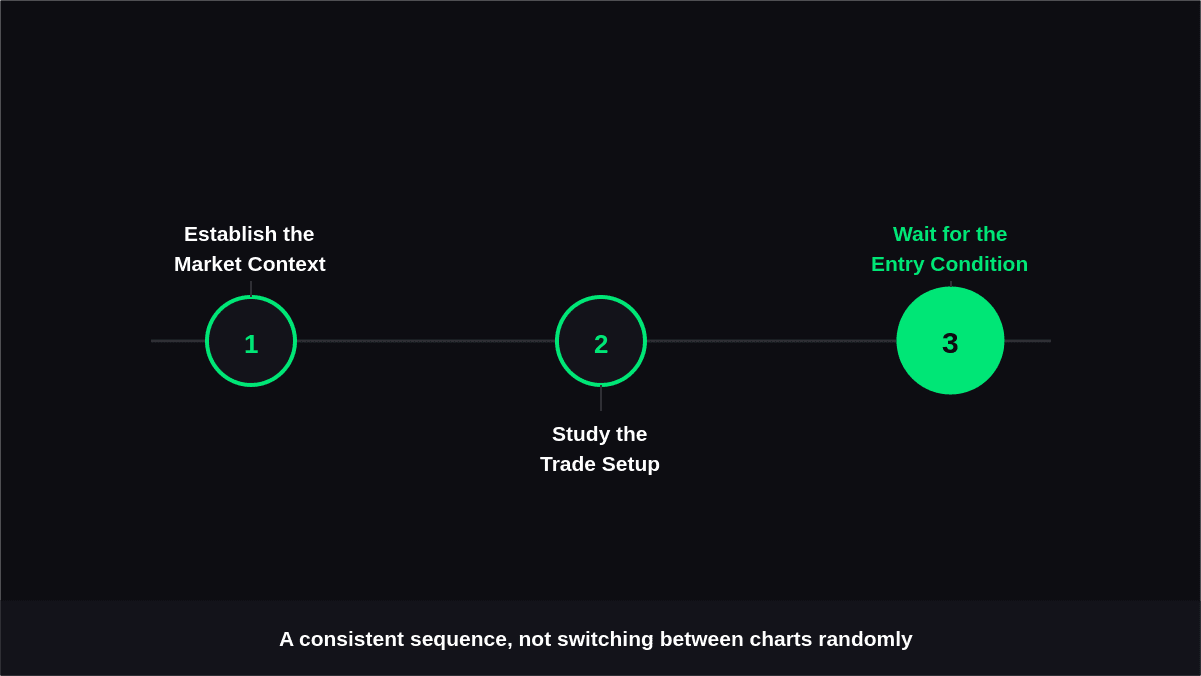
A multi-timeframe entry strategy should use a consistent sequence rather than switching between charts randomly.
1. Establish the Market Context
Start with the chart interval that best represents your intended trading horizon.
Identify:
- Current market structure
- Major swing points
- Important support and resistance
- Strong directional moves
- Consolidation areas
- Potential structural changes
Do not treat the initial directional assessment as an entry signal. Its purpose is to establish the conditions surrounding the potential trade.
2. Study the Trade Setup
Move to the next relevant timeframe and examine how price is behaving within that broader context.
Depending on the strategy, you may look for:
- Pullbacks
- Breakouts
- Retests
- Consolidation patterns
- Reactions around key levels
- Changes in short-term structure
At this stage, the question is whether an actionable setup is developing, not whether an entry should immediately be taken.
3. Wait for the Entry Condition
The final chart interval can be used to monitor the specific trigger defined by the strategy.
Possible triggers include:
- Confirmed breakouts
- Reversal patterns
- Pullback completion
- Price reactions
- Momentum conditions
- Indicator signals
The trigger should be defined before the trade rather than selected afterward because it happened to fit the chart.
What Does Timeframe Confirmation Mean?
Timeframe Confirmation does not require every chart to show an identical trend or signal.
Instead, confirmation means that the information across the selected intervals does not contradict the conditions required by the trading strategy.
For example, a broader bullish structure can coexist with a short-term decline. A trader may interpret the decline as a pullback if the larger structure remains intact, but the actual decision still depends on the predefined entry rules.
This is particularly important when indicators use higher-timeframe data. TradingView explains that higher-timeframe values can change while the relevant candle is still developing, and its multi-timeframe tools include options for waiting for the higher-timeframe candle to close before using its completed value.
As a result, traders should know whether a signal is based on a completed candle or information that is still changing.
How to Handle Conflicting Timeframes
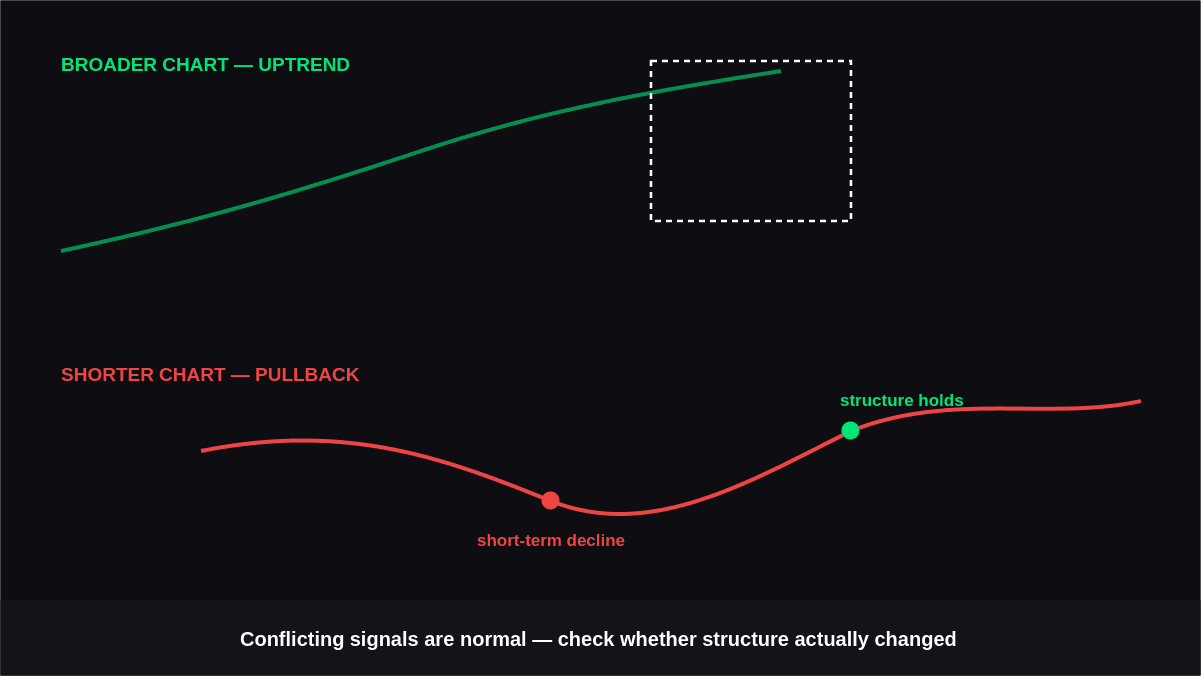
Different timeframes will sometimes produce conflicting information. This is a normal consequence of looking at price over different periods.
Suppose a broader chart shows an established uptrend while a shorter chart has turned bearish. Rather than immediately treating the short-term move as a reversal, examine the surrounding structure.
Consider:
- Has a meaningful swing point been broken?
- Is price approaching an important support or resistance area?
- Does the setup still meet the strategy's conditions?
- Is the short-term movement consistent with a normal pullback?
- Has the planned entry trigger actually occurred?
If the evidence is unclear, waiting for the setup to develop further can be preferable to forcing a decision.
Common Multi-Timeframe Analysis Mistakes
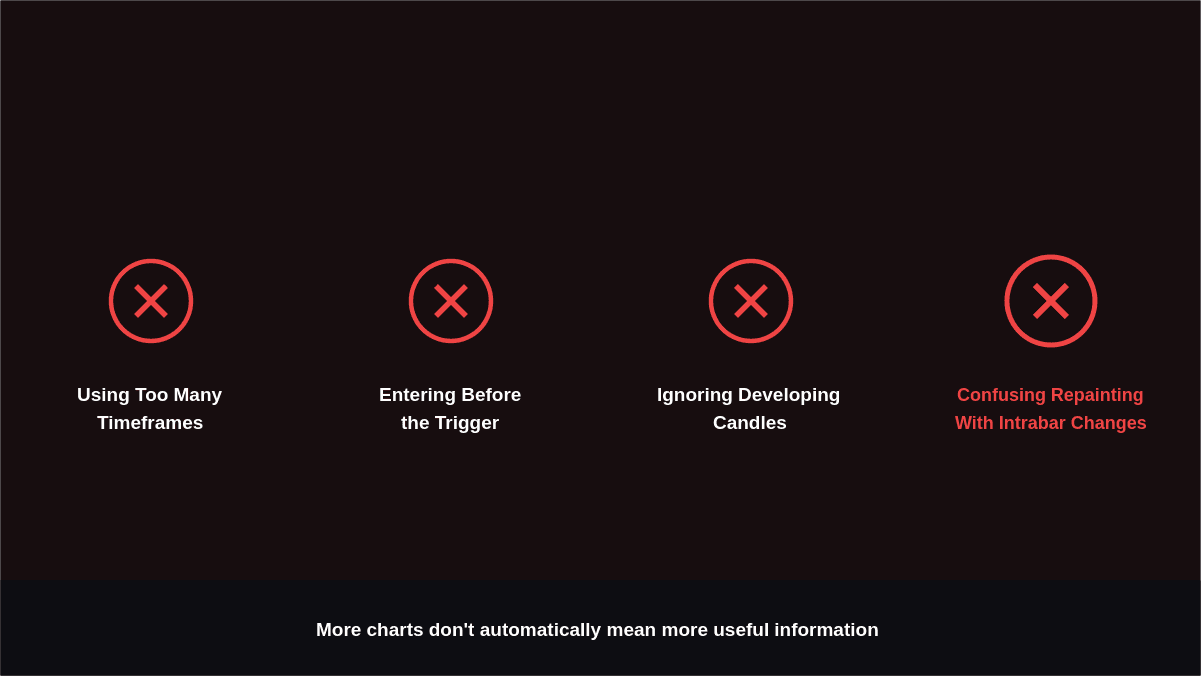
Here are some common mistakes traders make while analyzing multiple timeframes.
Using Too Many Timeframes
Adding more charts can create more information without necessarily creating more useful information.
Following numerous intervals may encourage traders to search for a signal that supports an existing bias. A consistent set of charts is easier to monitor, document, and test.
Entering Before the Trigger
A favorable market structure is not automatically an entry.
If a strategy requires a breakout, reversal, or other confirmation, entering before that condition occurs changes the original trading rules.
Ignoring Developing Candles
A signal on an open candle can change before that candle closes. This matters when evaluating indicators and higher-timeframe information.
Traders should distinguish between a developing signal and one based on confirmed price data.
Confusing Repainting With Normal Intrabar Changes
Not every change during a live candle means an indicator is repainting. While a candle is forming, its price information can change, which may also affect an indicator's current signal.
The important distinction is between normal intrabar changes and a signal that changes after the relevant candle has already closed. Traders can learn more about how to verify that an indicator doesn't repaint when evaluating whether historical signals remained consistent with what was visible in real time.
A useful way to evaluate this is to observe the indicator while the market is live, use Bar Replay, and compare the signals after candles have closed.
How Indicators Fit Into Multi Timeframe Trading
Indicators can supplement price analysis when they have a specific role within the strategy.
For example, one indicator might help identify market conditions while another provides an entry trigger. However, several indicators based on similar price inputs should not automatically be treated as independent confirmations.
Signal stability is another consideration. A non-repainting buy sell indicator can be evaluated based on whether its historical signals remain consistent after candles have closed.
Traders evaluating a buy sell signal indicator should also consider how the tool behaves in real time, what markets it is designed for, and whether its signals fit the intended trading approach.
The goal is to make indicators part of a defined process rather than adding more tools whenever the market becomes difficult to interpret.
Multi-Timeframe Analysis and Risk Management
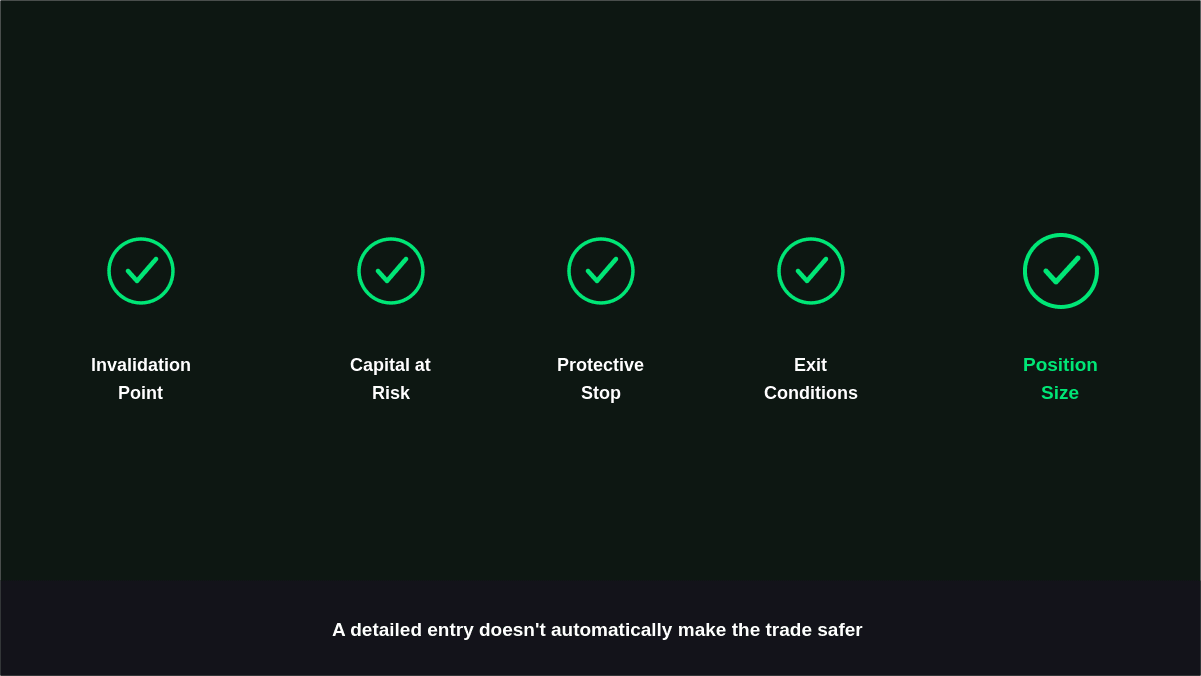
Entry timing is only one part of a trading plan.
Before entering a position, traders should establish:
- The point at which the trade idea becomes invalid
- The amount of capital being risked
- An appropriate protective stop
- Potential exit conditions
- Position size based on the planned risk
A detailed entry on a shorter timeframe does not automatically make the trade safer. Risk parameters should still reflect the strategy and relevant market structure.
This approach can help organize the entry process, but it does not replace risk management.
A Practical Workflow
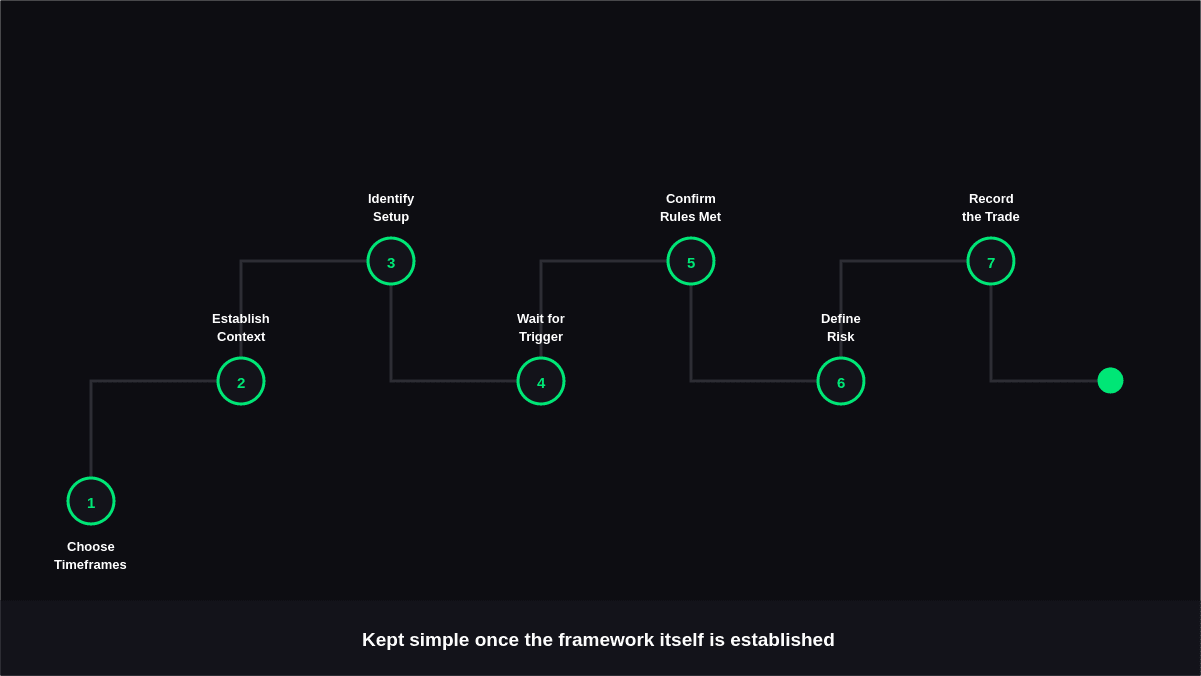
Once the framework is established, the process can be kept relatively simple:
- Choose timeframes that match your trading horizon.
- Establish the broader market context.
- Identify whether a valid setup is developing.
- Wait for the predefined entry trigger.
- Check that the setup still meets your trading rules.
- Define risk and invalidation before entering.
- Record the trade for later review.
Testing the process across different market conditions can help determine whether the selected timeframes and entry rules actually fit the strategy.
Conclusion
Multi Timeframe Analysis provides a structured way to examine potential entries from different perspectives. Rather than relying on one chart, traders can use broader market information, study the developing setup, and then wait for a specific entry condition.
The approach works best when the selected timeframes have clear purposes and traders understand that conflicting signals, developing candles, and indicator behavior are normal parts of market analysis.
Ultimately, the goal is not to find certainty across multiple charts. It is to create a consistent process that can be tested, documented, and applied according to the rules of a specific trading strategy.