A Trading Indicator can make charts easier to interpret, but its signals should not automatically be treated as reliable trading decisions. An indicator may appear effective on a few charts while producing very different results across other assets, timeframes, or market conditions.
Testing helps traders understand how an indicator behaves before incorporating it into a repeatable strategy.
A proper evaluation goes beyond checking whether an indicator correctly identified a few profitable entries. Traders need to examine historical performance, signal consistency, market conditions, risk, and whether the indicator continues to work on data it has not been optimized against.
This creates a more objective way to analyze backtest results and determine whether an indicator provides useful information or simply looks convincing in hindsight.
In this guide, we will explore:
- What a Trading Indicator is
- Why testing matters before using an indicator
- Five practical steps for testing an indicator
- How to compare results across different market conditions
- Common mistakes that can distort indicator testing
- Frequently asked questions about testing indicators
What Is a Trading Indicator?
A Trading Indicator is a mathematical calculation applied to market data to help traders interpret price behavior. Depending on its design, an indicator may use price, volume, volatility, momentum, or a combination of these inputs to generate information about market conditions.
Common examples include moving averages, Relative Strength Index (RSI), Moving Average Convergence Divergence (MACD), Bollinger Bands, and volume-based tools.
Some indicators are designed to identify trends, while others attempt to highlight momentum, potential reversals, volatility, or changes in market participation. Together, these technical indicators provide different ways to interpret market behavior.
However, an indicator does not guarantee that a particular trade will be profitable. Its usefulness depends on how its signals are interpreted, the market being traded, the timeframe selected, and the rules surrounding entries and exits.
Why Should You Test an Indicator Before Trading?
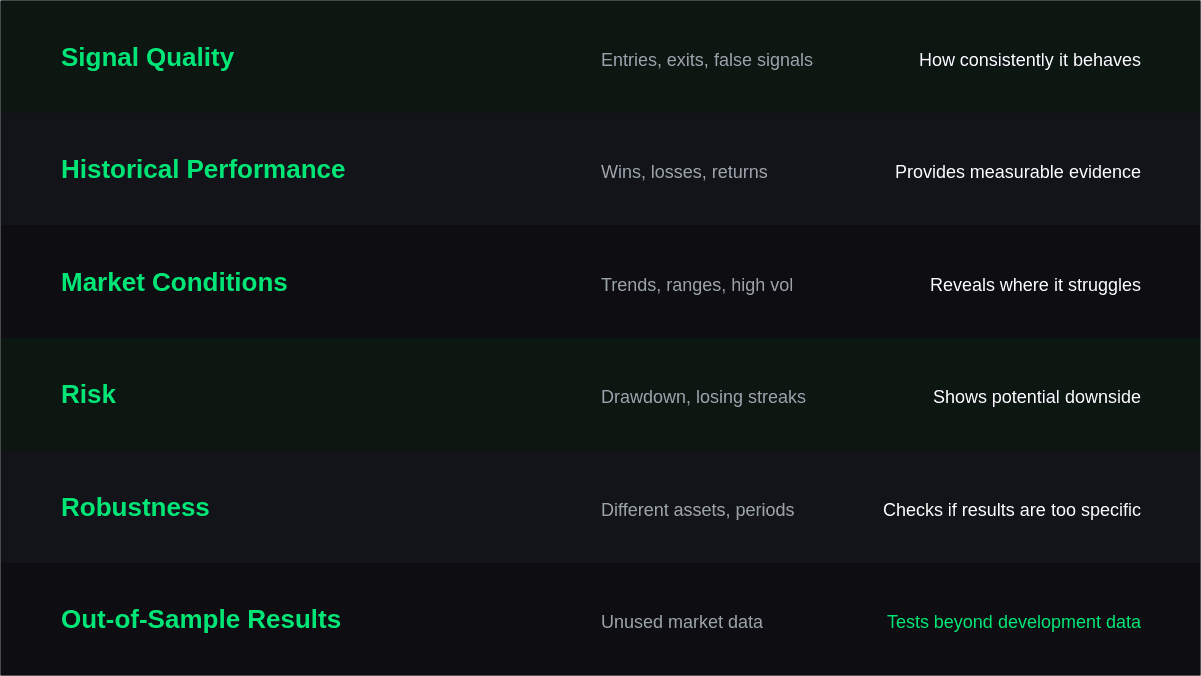
Testing provides evidence about how an indicator behaves instead of relying solely on visual impressions. A signal that looks accurate on a handful of historical charts may produce a different outcome when every qualifying signal is evaluated.
| Testing Area | What to Examine | Why It Matters |
|---|---|---|
| Signal quality | Entries, exits, false signals | Shows how consistently the indicator behaves |
| Historical performance | Wins, losses, returns | Provides measurable evidence |
| Market conditions | Trends, ranges, high volatility | Reveals where the indicator may struggle |
| Risk | Drawdown and losing streaks | Shows the potential downside |
| Robustness | Different assets and periods | Helps identify whether results are overly specific |
| Out-of-sample results | Unused market data | Tests whether performance holds beyond development data |
A structured process also reduces the risk of changing rules every time a result looks disappointing. The goal is not to make historical results look perfect. Instead, testing should reveal the strengths, weaknesses, and limitations of the indicator.
5 Steps to Follow When Testing a Trading Indicator
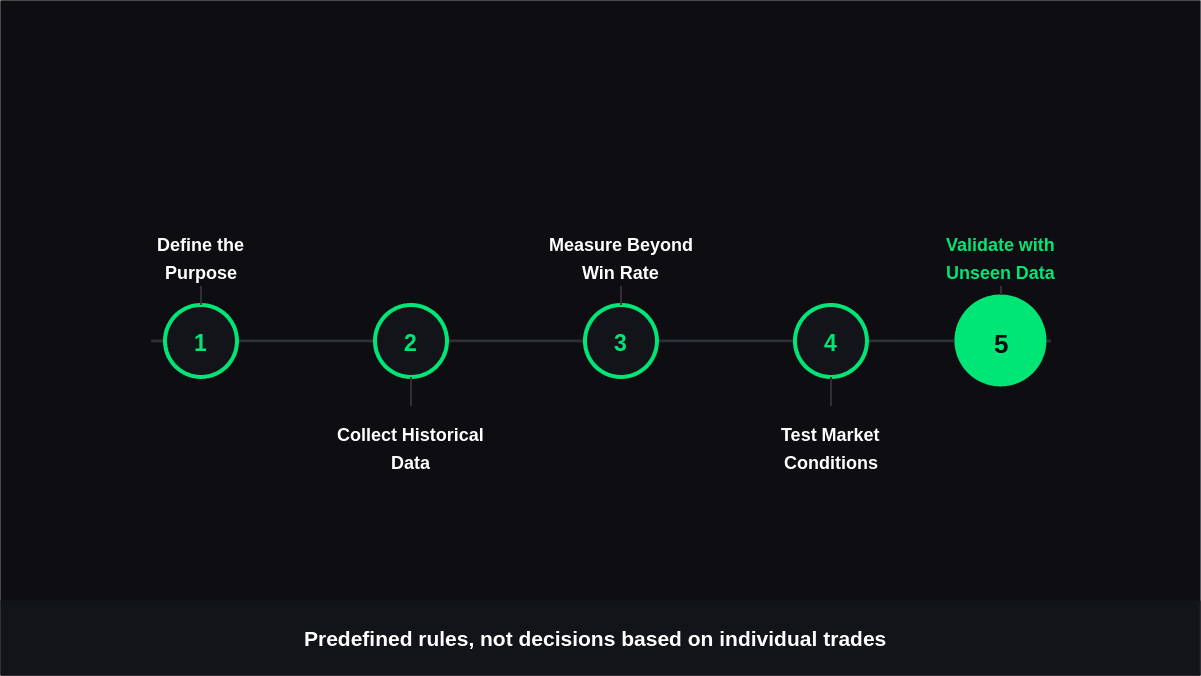
Testing should follow predefined rules rather than being based on individual trades that happen to look successful. The following five steps create a practical framework for evaluating an indicator.
1. Define Exactly What the Indicator Should Do
Start by establishing the purpose of the indicator. Decide whether you are testing it for trend identification, entry signals, exit timing, momentum confirmation, volatility analysis, or another specific function.
Next, define what qualifies as a signal. For example, you might test a long signal when a particular condition occurs and close the position when another predefined condition appears.
Write these rules before reviewing a large amount of historical data.
Your test should clearly specify:
- The market or assets being tested
- The timeframe
- Entry conditions
- Exit conditions
- Stop-loss rules
- Position-sizing assumptions
- Any filters or confirmation requirements
This prevents the testing process from becoming subjective.
2. Collect Historical Data for Testing
The next step is to gather enough historical data to observe the indicator across different situations. Testing only a short period can create a misleading impression because markets do not behave consistently throughout every period.
Include periods containing different characteristics, such as:
- Strong upward trends
- Sustained downward trends
- Sideways markets
- High-volatility sessions
- Lower-volatility periods
- Sharp market reversals
This is where indicator backtesting becomes useful. Instead of focusing on isolated examples, traders can evaluate how predefined indicator rules would have behaved across a larger historical sample.
The objective is to collect enough observations to identify recurring behavior rather than relying on a few memorable trades.
3. Measure More Than the Winning Percentage
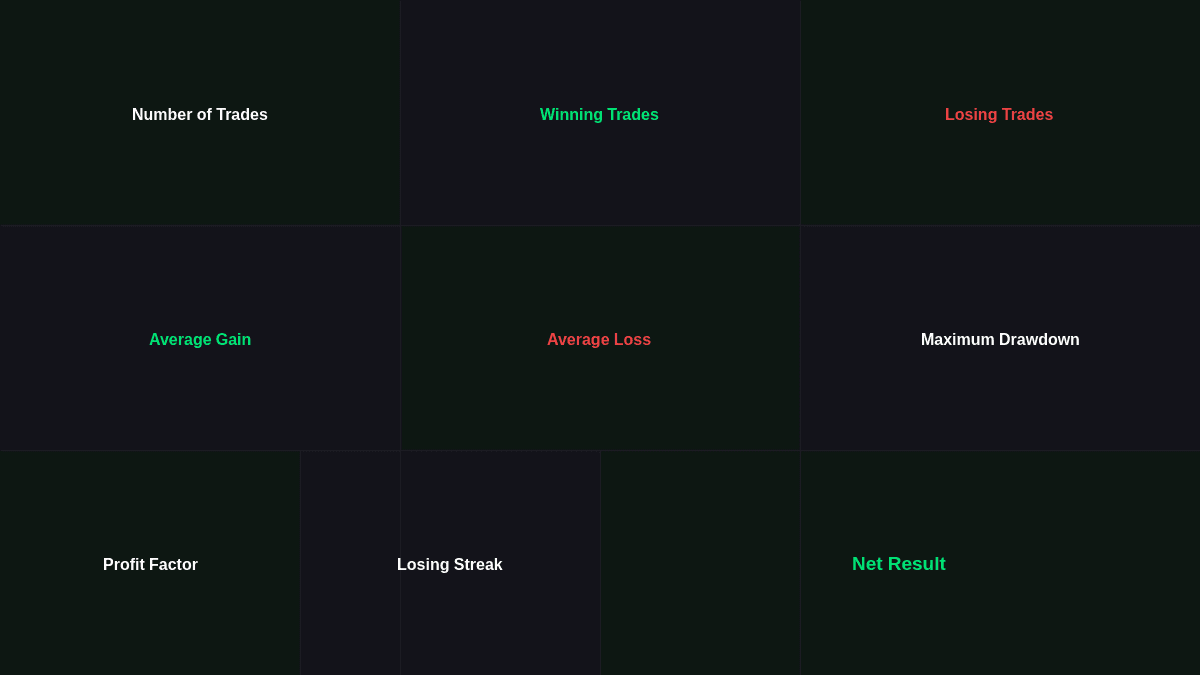
A high win rate does not automatically mean an indicator produces a useful trading approach. A system could win frequently while allowing occasional losses that are significantly larger than its average winning trades.
Record several measurements during the test, including:
- Number of trades
- Winning trades
- Losing trades
- Average gain
- Average loss
- Maximum drawdown
- Profit factor
- Largest losing streak
- Net result
These measurements provide more context than a simple percentage of winning trades.
For example, two tests might both produce a 60% win rate. If one has much larger losses, deeper drawdowns, and weaker average returns, the results are materially different.
The purpose of measurement is to understand the complete distribution of outcomes rather than selecting one attractive statistic.
4. Test Different Market Conditions and Assets
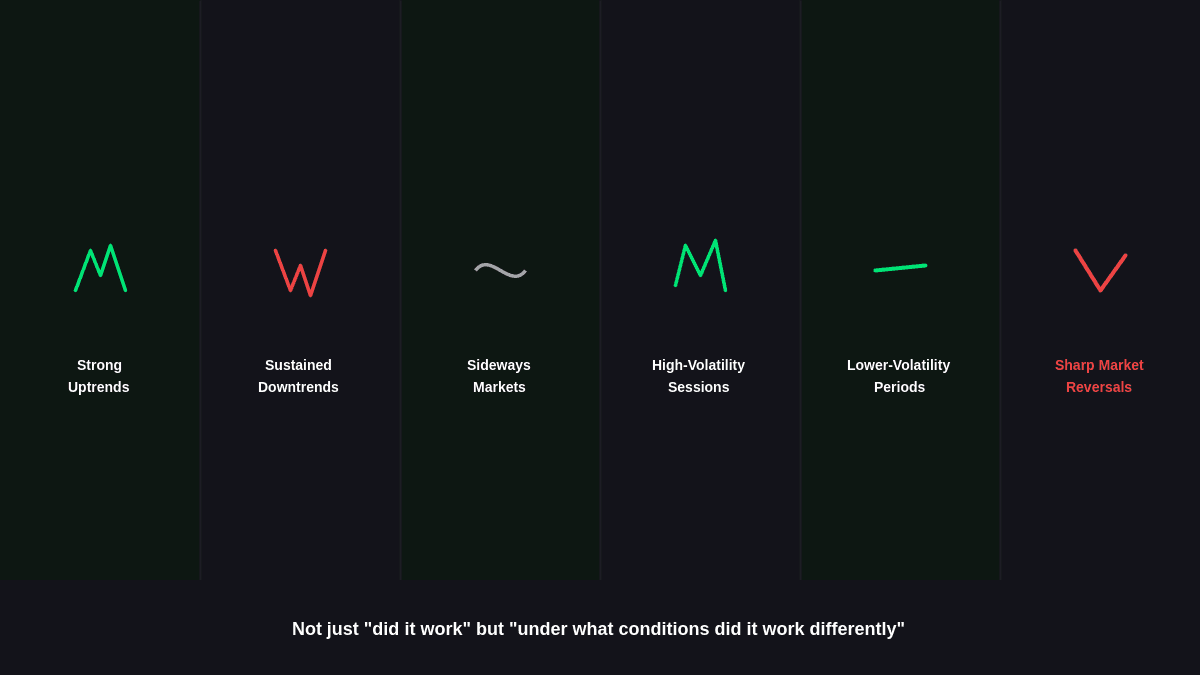
An indicator may behave differently depending on what is happening in the market. A trend-following indicator, for instance, may generate useful signals during persistent directional movement but produce frequent signals during a range-bound period.
Testing should therefore extend beyond the asset or period where the indicator initially appeared successful.
Apply the same rules to multiple relevant conditions and, where appropriate, different assets. Do not modify the rules after seeing each new result simply to improve historical performance.
This step is particularly important when evaluating technical analysis indicators because their behavior can depend heavily on volatility, liquidity, timeframe, and market structure.
A useful test should help answer not only "Did it work?" but also "Under what conditions did it work differently?"
5. Validate Results With Unseen Data
After testing and developing the rules, evaluate them against data that was not used during the initial development process. This is commonly called out-of-sample testing.
The principle is straightforward: if the indicator only performs well on the data used to develop or optimize it, the historical results may not tell you much about how it behaves on new information.
Avoid repeatedly adjusting the indicator after every disappointing result. Excessive optimization can make a strategy increasingly tailored to historical data.
A stronger validation process keeps the testing rules fixed and then measures the results on the unused dataset.
You can also compare the results from the development period with the validation period. Large differences do not automatically prove that an indicator is useless, but they can signal that further investigation is needed.
How to Interpret Your Testing Results
Testing does not need to produce a perfect performance record to be useful. In fact, unusually strong historical results may deserve additional scrutiny, especially when they depend on many optimized settings.
Look for consistency across different periods rather than focusing on the single best stretch of performance. Compare the indicator's behavior during favorable and unfavorable environments, and examine whether its weaknesses are understandable.
The final question should be whether the indicator provides information that fits the trading rules you intend to follow. An indicator can still be useful even when it produces losing signals because no technical tool is expected to predict every market movement.
The value comes from understanding what the indicator does well, where it tends to struggle, and how those characteristics fit within a broader risk-management process.
Common Mistakes When Testing Indicators
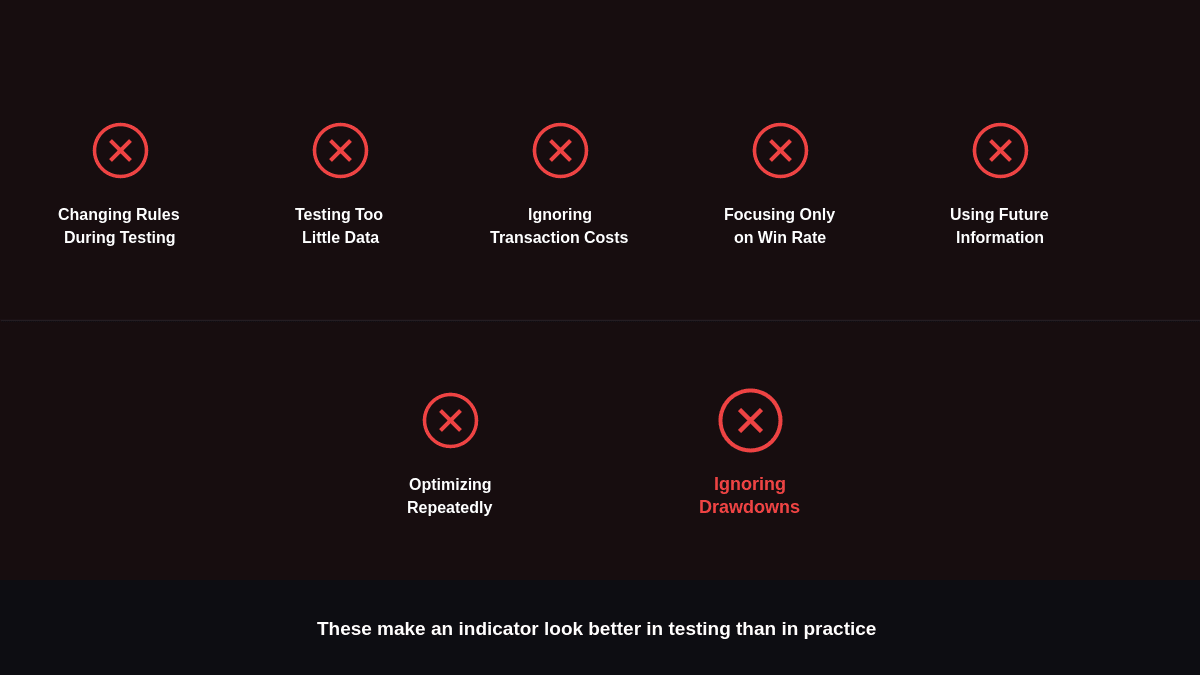
Even a well-designed testing process can become unreliable if the methodology is inconsistent. Several mistakes are particularly important to avoid.
- Changing rules during testing: Adjusting conditions whenever results look unfavorable can make the final results difficult to interpret.
- Testing too little data: A small sample may not represent different market environments.
- Ignoring transaction costs: Commissions, spreads, and slippage can affect real-world results.
- Focusing only on win rate: Win percentage does not show the size or distribution of gains and losses.
- Using future information: A test should only use information that would have been available at the time of each signal.
- Optimizing repeatedly: Excessive adjustments can produce historical results that are difficult to reproduce.
- Ignoring drawdowns: A strategy's return should be considered alongside the losses experienced along the way.
These issues can make an indicator appear more effective in historical testing than it may be under practical conditions.
Conclusion
Testing a Trading Indicator before using it with real capital can provide a clearer understanding of its historical behavior and limitations.
A disciplined process starts with predefined rules, uses sufficient historical data, measures multiple performance factors, examines different market conditions, and finishes with validation on unseen data.
The goal is not to prove that an indicator will always work. Markets change, and historical performance cannot guarantee future results. Instead, careful testing helps separate repeatable observations from isolated examples and gives traders better information to validate trading strategies and decide how an indicator should be used.
A well-tested indicator should therefore be viewed as one component of a broader trading process rather than a standalone source of guaranteed signals.