A strong market move does not continue indefinitely. At some point, buying or selling pressure can weaken, even when price still appears to be moving in the same direction.
Learning how to spot exhaustion in a trend can help traders recognize when momentum is losing strength and evaluate whether a move may be approaching a pause, consolidation, or reversal.
Exhaustion is not the same as an immediate trend change. Instead, it is a condition that suggests the existing move may have less strength behind it than before.
Traders can examine price structure, momentum, volume, and volatility together using technical indicators to build a more reliable assessment.
What Does Trend Exhaustion Mean?
Trend exhaustion occurs when the force driving an established price move begins to weaken. In an uptrend, buyers may struggle to push prices meaningfully higher. In a downtrend, sellers may find it increasingly difficult to create new lows.
This weakening can appear gradually rather than through one obvious candle or indicator reading.
For example, an asset may continue making higher highs while each new high produces a smaller price advance. That does not prove that the uptrend has ended, but it can indicate that buying pressure is becoming less effective.
The key distinction is between weakening momentum and an actual reversal. Exhaustion provides a warning that the current trend deserves closer examination.
5 Ways to Spot Exhaustion in a Trend
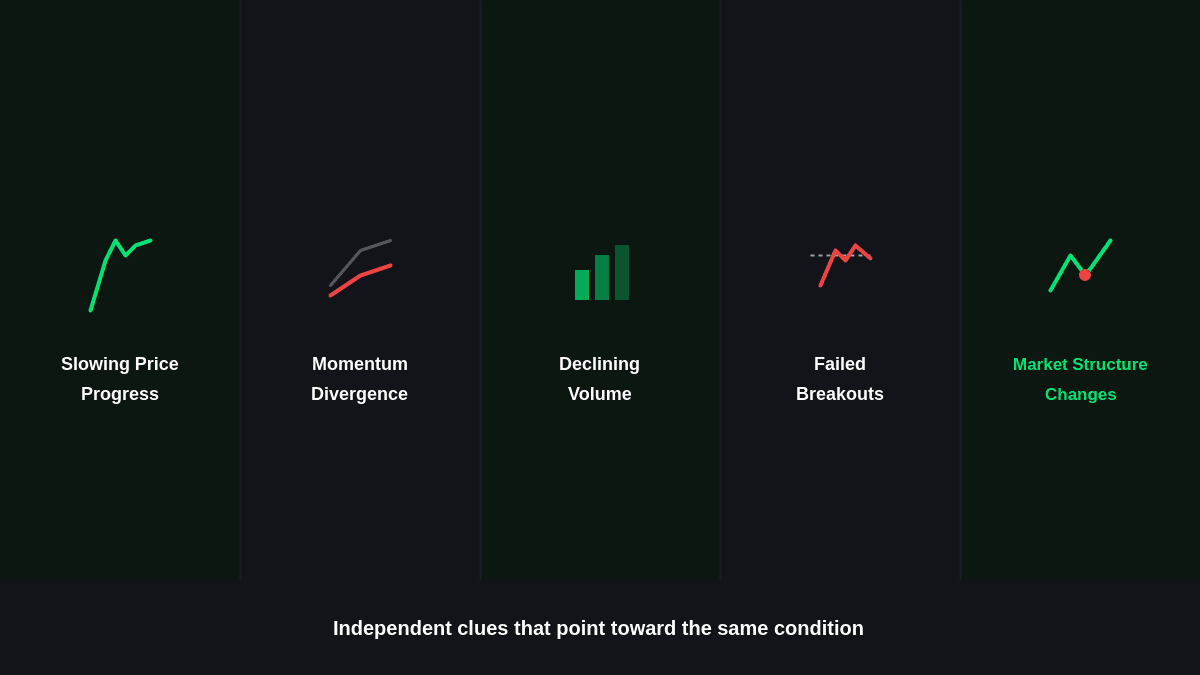
There is no single signal that confirms exhaustion in every market. Traders can instead look for several independent clues that point toward the same condition.
1. Watch for Slowing Price Progress
One of the simplest trend exhaustion signals is a decline in the distance price travels during successive pushes.
Suppose an uptrend produces:
- First advance: large price movement
- Second advance: moderate movement
- Third advance: relatively small movement
Prices may still be rising, but the trend is producing less progress with each push.
This can show that buyers are still active but are having greater difficulty extending the move. The same principle applies in reverse during a downtrend when successive declines become less substantial.
2. Compare Momentum With Price
Momentum indicators can reveal when price and underlying momentum are no longer moving together.
Common tools include:
- Relative Strength Index (RSI)
- Moving Average Convergence Divergence (MACD)
- Stochastic oscillator
A bearish divergence may occur when price reaches a higher high while an oscillator forms a lower high. A bullish divergence can appear when price makes a lower low while the oscillator forms a higher low.
Divergence does not automatically signal a reversal. It is better viewed as evidence that the trend's internal momentum may be changing.
3. Examine Trading Volume
Volume can provide another perspective on whether participation is supporting a price move.
During a healthy advance, increasing volume can accompany strong upward price movement. If price continues climbing while volume gradually declines, the move may deserve closer attention.
This type of volume divergence in trading does not necessarily mean sellers have taken control. It simply suggests that the price movement may be receiving less participation than earlier stages of the trend.
Volume should therefore be interpreted alongside price structure rather than treated as a standalone reversal signal.
4. Look for Failed Breakouts
A trend can show weakness when price repeatedly attempts to extend beyond an important level but cannot maintain the breakout.
For instance, an uptrend may push above a previous resistance level before quickly falling back below it. If similar attempts fail repeatedly, traders may interpret this as evidence that buyers are struggling to maintain control.
A failed breakout becomes more informative when it occurs alongside other exhaustion clues, such as weakening momentum or unusual volume.
5. Track Changes in Market Structure
Market structure can help distinguish ordinary consolidation from a more meaningful change in direction.
An uptrend generally maintains higher highs and higher lows. If price eventually breaks a significant higher low and begins producing lower highs, the structure has changed.
Likewise, a downtrend may lose its bearish structure after price breaks an important lower high and subsequently establishes higher lows.
These structural changes can provide stronger confirmation than simply observing that price has moved more slowly.
Exhaustion Signals vs. Trend Reversal
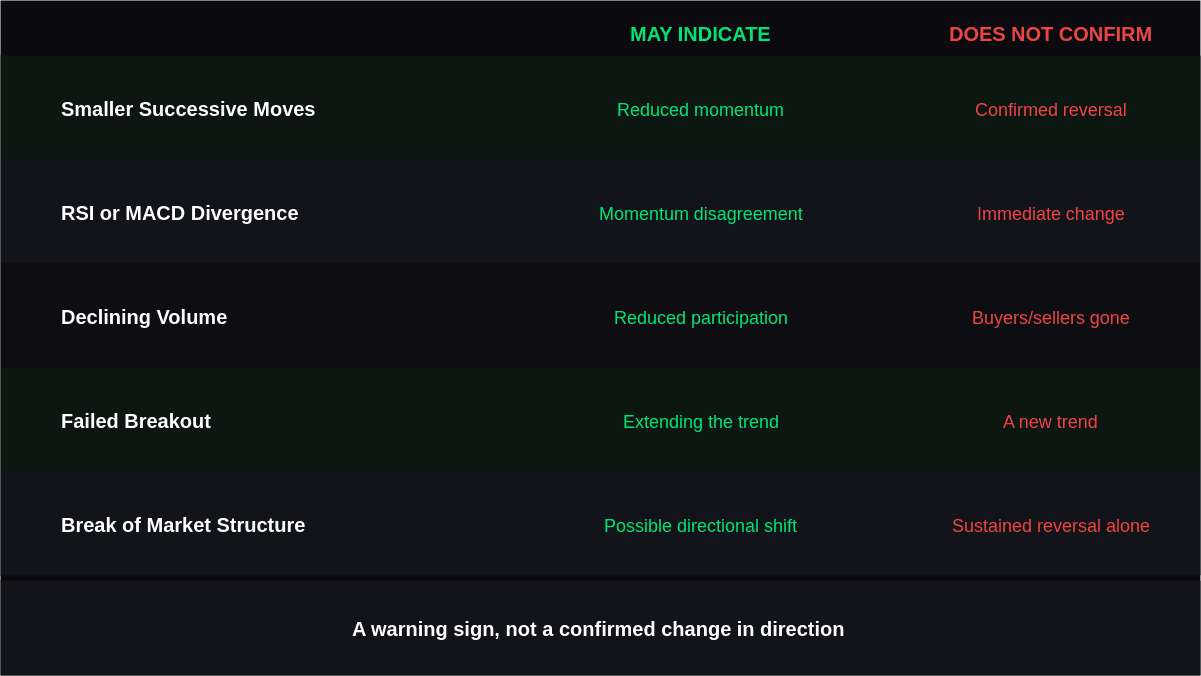
Exhaustion and reversal are related but different concepts. Exhaustion describes weakening pressure within the existing trend, while a reversal involves a more established change in directional structure.
| Observation | What It May Indicate | What It Does Not Confirm |
|---|---|---|
| Smaller successive price moves | Reduced momentum | A confirmed reversal |
| RSI or MACD divergence | Momentum disagreement | Immediate direction change |
| Declining volume continuation | Reduced participation | Buyers or sellers disappeared |
| Failed breakout | Extending the trend | A new trend |
| Break of market structure | Possible directional shift | A sustained reversal by itself |
This distinction matters because markets can remain in a trend for longer than expected after early exhaustion appears.
How to Confirm a Potential Trend Change
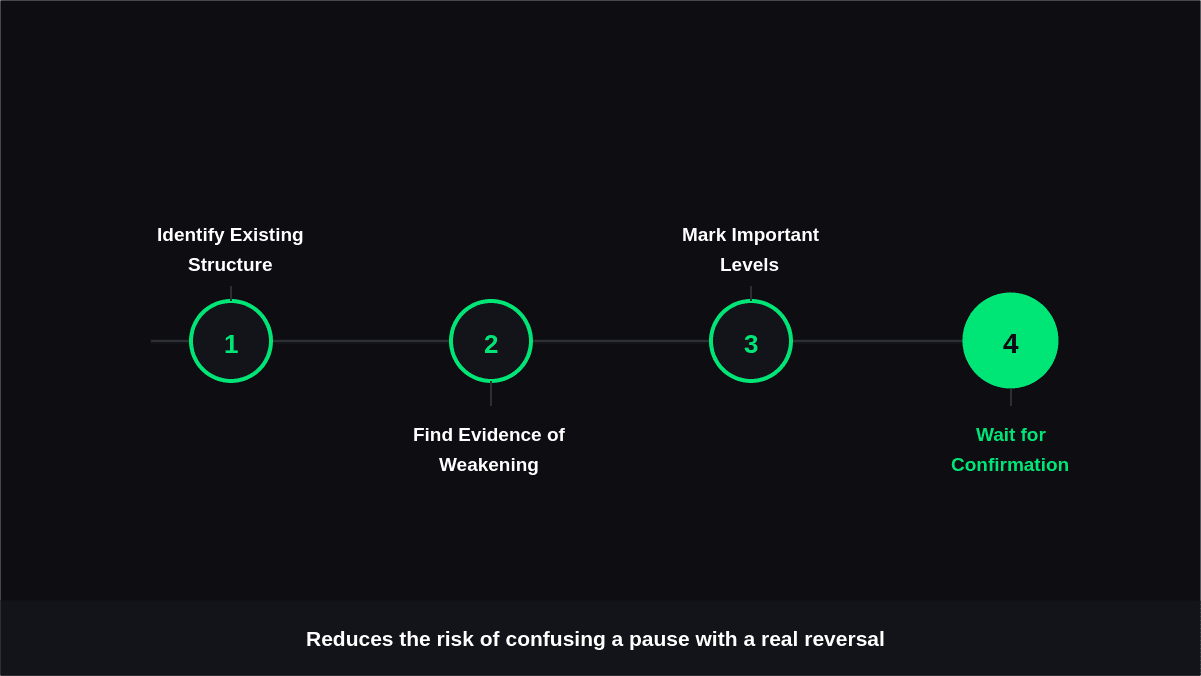
Once several exhaustion clues appear, traders can wait for additional evidence rather than reacting to the first warning.
A practical process is:
Step 1: Identify the existing structure
Determine whether price is making higher highs and higher lows or lower highs and lower lows.
Step 2: Find evidence of weakening
Check whether price progress, momentum, or participation has changed compared with earlier parts of the move.
Step 3: Mark important levels
Identify recent swing highs, swing lows, support, and resistance that could determine whether structure remains intact.
Step 4: Wait for confirmation
Look for a meaningful structure break, failed continuation, or sustained movement in the opposite direction before treating exhaustion as a potential reversal.
This approach reduces the risk of confusing a temporary pause with a genuine change in market direction.
Common Mistakes When Reading Trend Exhaustion
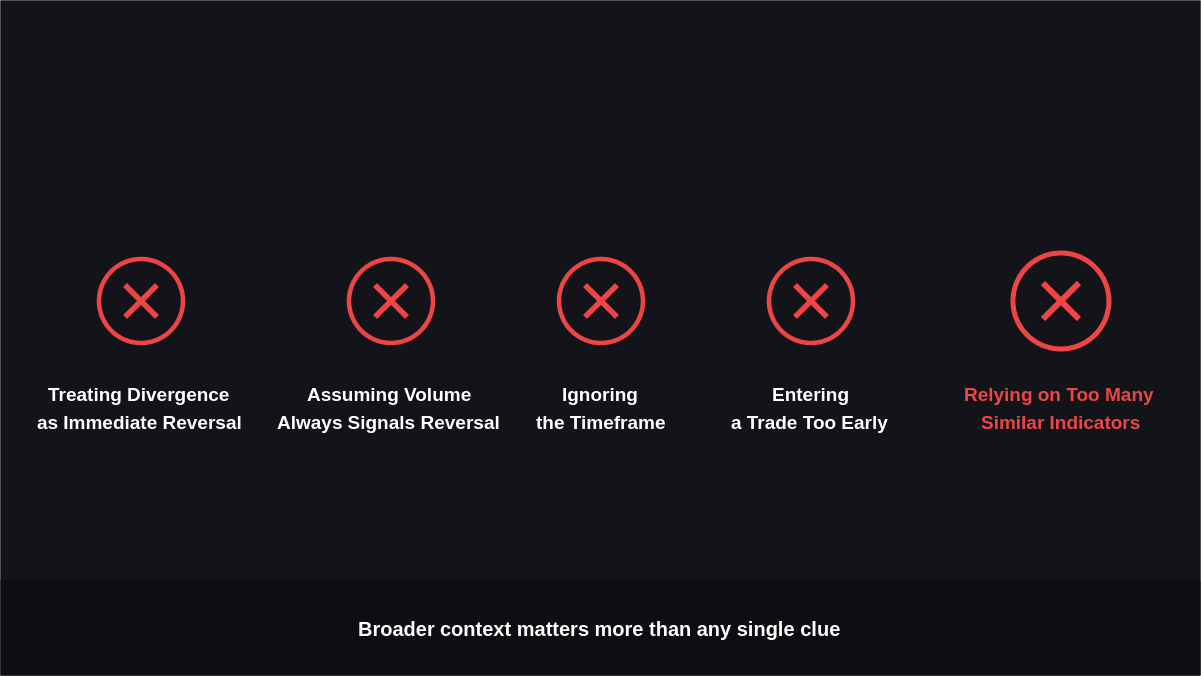
Reading exhaustion signals correctly requires looking at the broader market context rather than reacting to one clue. Avoid these common mistakes when analyzing a weakening trend:
- Treating divergence as an immediate reversal
- Assuming high volume always signals a reversal
- Ignoring the timeframe
- Entering a trade too early
- Relying on too many similar indicators
Conclusion
Learning to Spot Exhaustion in a Trend is primarily about recognizing when an established move is becoming less effective rather than predicting an exact turning point.
Price progress, momentum, volume, failed breakouts, and market structure each provide different information about the condition of a trend.
No single sign of trend reversal guarantees that a new direction will develop.
By combining independent evidence and waiting for meaningful structural confirmation, traders can validate trading strategies and separate temporary weakness from a more significant change in market behavior.