A Strong Market Trend is more than a price moving steadily in one direction. A reliable trend usually shows consistent market structure, sustained momentum, and enough participation to support the move.
Traders can evaluate these characteristics by studying higher highs and higher lows, volume behavior, volatility, and technical indicators. Understanding these signals can help distinguish a genuine directional move from a short-lived price swing.
This guide explains practical ways to assess trend strength without relying on a single indicator or isolated price movement.
What Is a Market Trend?
A market trend is the general direction in which the price of an asset moves over a period of time. It can be upward, downward, or sideways, depending on how buyers and sellers interact with the market.
An uptrend typically develops through a series of higher highs and higher lows, while a downtrend forms lower highs and lower lows. A sideways trend occurs when price remains within a relatively defined range, often moving between areas of support resistance without establishing a clear direction.
Traders study these movements to understand the broader market environment rather than relying on individual price changes.
What Makes a Market Trend Strong?
Not every upward or downward move represents a meaningful trend. A strong trend develops when price repeatedly moves in the same direction while maintaining a recognizable structure.
For example, an uptrend generally forms:
- Higher highs
- Higher lows
- Consistent buying pressure
- Limited or shallow pullbacks
A downtrend shows the opposite structure, with lower highs and lower lows. The important point is consistency. One large candle or sudden price jump does not automatically establish a strong trend.
5 Steps to Consider to Spot a Strong Trend in Trading
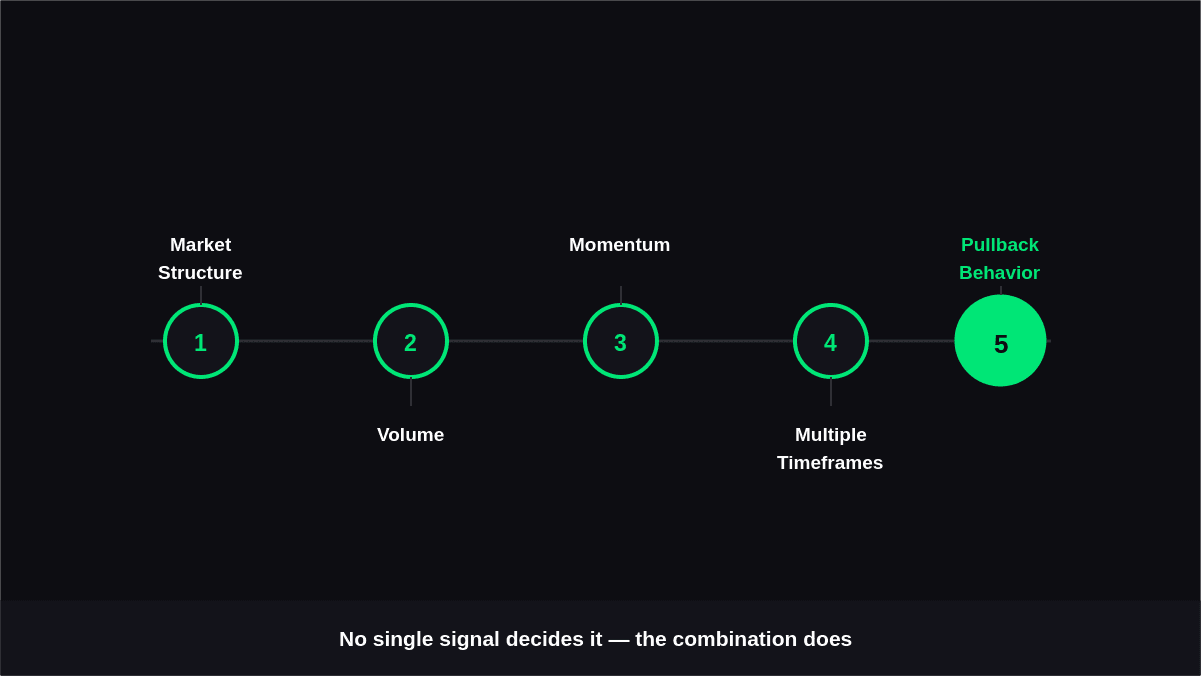
These five steps can help traders distinguish a sustained directional move from a short-term price fluctuation.
By combining price structure, volume, momentum, and timeframe analysis, you can assess whether a trend has enough strength to remain intact.
1. Start With Market Structure
Market structure provides one of the clearest ways to determine whether price is actually trending. Instead of focusing on individual candles, examine the sequence of major swing points:
- Uptrend: Price forms higher highs and higher lows, with pullbacks generally holding above previous important lows.
- Downtrend: Price forms lower lows and lower highs, with rallies typically failing below previous significant highs.
- Sideways market: Price moves within a defined range without consistently creating new highs or lows.
This approach helps answer a basic question: Is the market consistently progressing in one direction, or is it simply moving within a range?
A market that repeatedly breaks its established structure may be transitioning into a new phase rather than maintaining the existing trend.
2. Check Whether Volume Supports the Move
Price direction alone does not tell you how much participation is behind a move. Volume can provide additional context.
When price advances while trading activity remains healthy, it can indicate that the move has broader participation.
Similarly, declining prices accompanied by stronger volume may reinforce bearish pressure.
However, volume should not be treated as automatic confirmation. A sudden volume spike can occur because of news, liquidations, or other short-term events.
The useful comparison is between price behavior and volume behavior over time rather than looking at one unusually high-volume candle.
3. Measure Momentum Without Relying on One Indicator
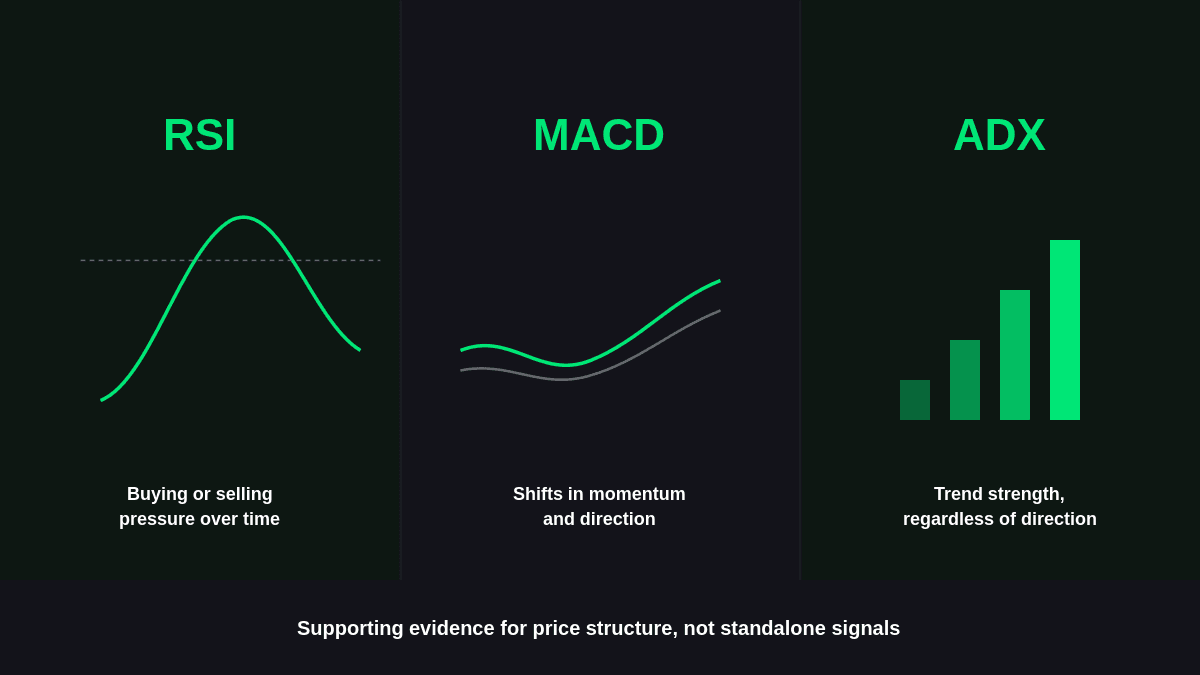
Momentum indicators can help determine whether a directional move is maintaining strength. Traders can use several indicators for different types of momentum analysis:
- RSI: Helps assess whether buying or selling pressure has remained strong over a given period.
- MACD: Helps identify changes in momentum and potential shifts in the direction of a move.
- ADX: Measures trend strength without focusing on whether the trend is bullish or bearish.
These tools work best as supporting evidence rather than standalone signals. If price structure points upward but momentum repeatedly weakens, the trend may be losing strength.
Conversely, sustained momentum alongside a healthy price structure can provide stronger confirmation.
4. Compare Multiple Timeframes
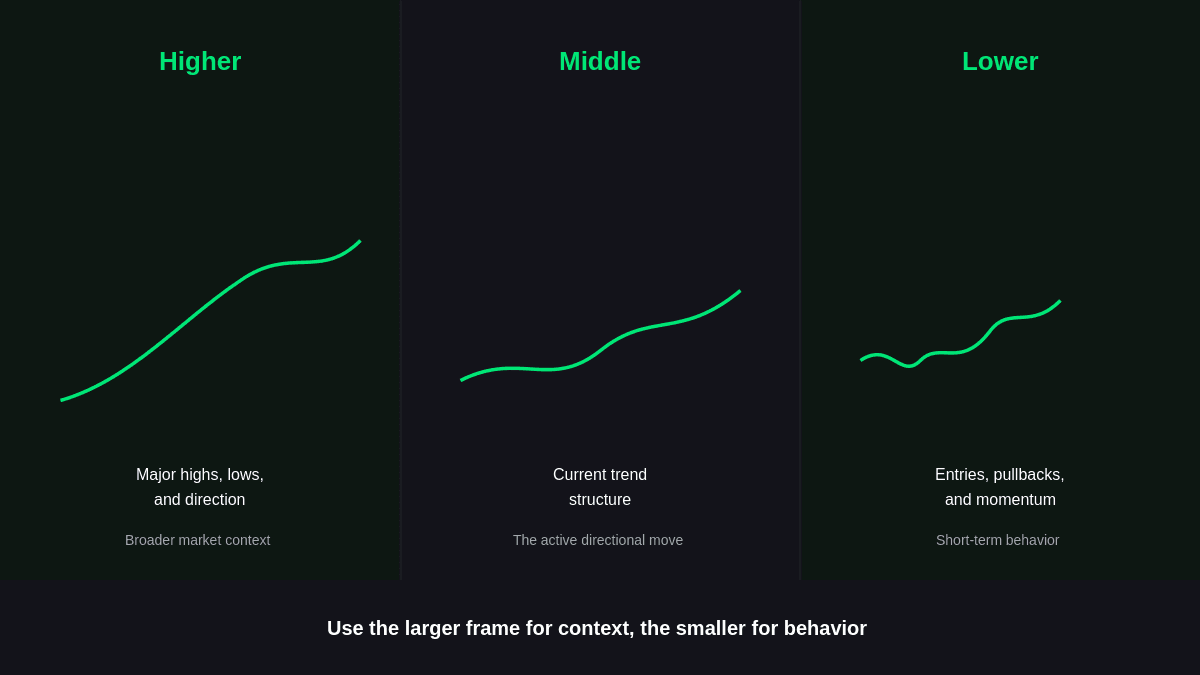
A trend can look strong on a short-term chart while appearing insignificant on a longer timeframe.
For example, a stock may rally sharply on a 15-minute chart while still sitting inside a broader daily downtrend. Looking at multiple timeframes helps put the current move into context.
A practical process is:
| Timeframe | What to Examine | Why It Matters |
|---|---|---|
| Higher | Major highs, lows, and direction | Establishes broader market context |
| Middle | Current trend structure | Shows the active directional move |
| Lower | Entries, pullbacks, & momentum | Helps analyze short-term behavior |
The goal is not to make every timeframe agree perfectly. Instead, use the larger timeframe to understand the environment and the lower timeframe to examine how price is behaving within it.
5. Evaluate Pullbacks and Trend Continuation
The way a market reacts after moving against its main direction can reveal useful information about trend quality.
In a healthy uptrend, pullbacks may remain relatively controlled before buyers return. If price repeatedly recovers and establishes new highs, the underlying structure remains intact.
A warning sign appears when pullbacks become increasingly deep or start breaking important swing levels.
The same principle applies to bearish markets. Strong selling trends may experience temporary rallies, but repeated failure to reclaim significant resistance can preserve the broader downward structure.
This makes pullback behavior different from simply asking whether price is currently rising or falling.
Signs That a Trend May Be Weakening
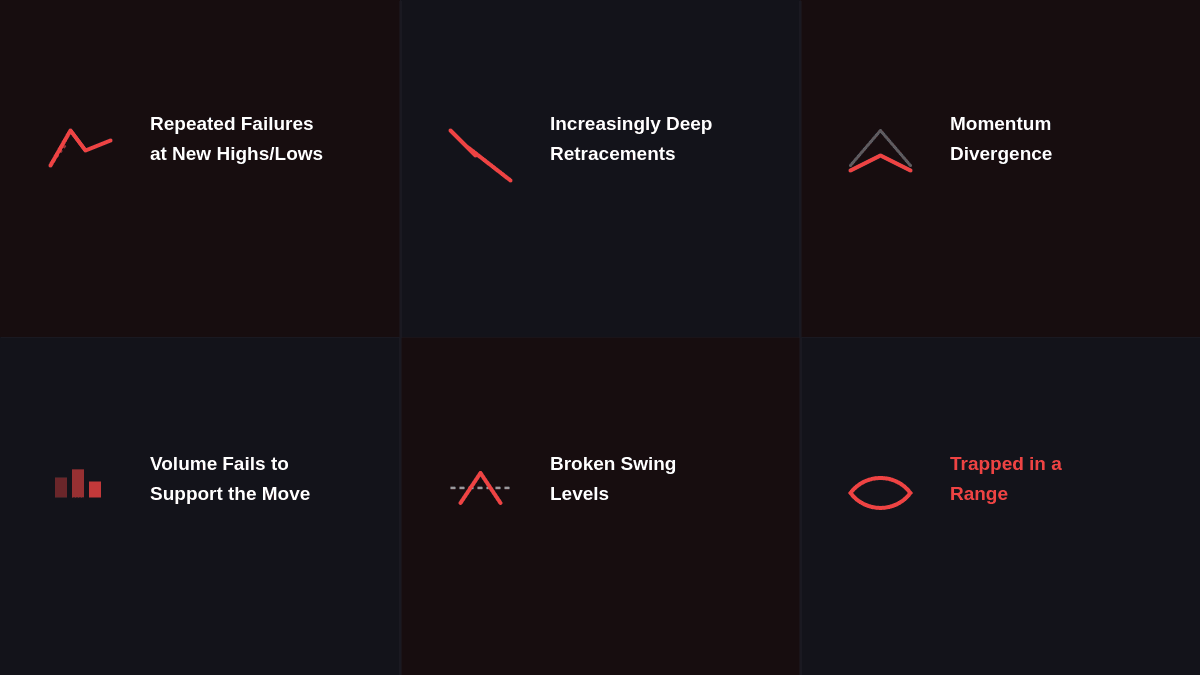
Even an established trend can lose strength. Traders can watch for changes such as:
- Repeated failures to create new highs or lows
- Increasingly deep retracements
- Momentum divergence
- Volume failing to support continued movement
- Breaks of important swing levels
- Price becoming trapped in a range
These signals do not guarantee a reversal. They indicate that the market's previous behavior is changing and may require reassessment.
How to Combine the Evidence
No single measurement can confirm trend strength in every market condition. A more reliable assessment comes from combining several independent observations.
For instance, a potentially strong bullish setup might show:
Higher highs and higher lows → supportive volume → sustained momentum → orderly pullbacks → alignment with the broader timeframe.
When several of these conditions appear together, the trend has more supporting evidence than when only one indicator produces a signal.
This approach also reduces the risk of treating a temporary price spike as a sustained market move.
Conclusion
Identifying a Strong Market Trend requires more than spotting a series of green or red candles. Traders can assess trend quality by examining price action concepts, market structure, volume, momentum, multiple timeframes, and the behavior of pullbacks.
These factors provide different pieces of information, allowing traders to build a more complete view of the market.
Rather than searching for one perfect signal, focus on whether several forms of evidence support the same directional behavior.