Traders often see a buy or sell signal on a chart and immediately focus on whether the setup could produce a profitable trade. However, a signal by itself does not explain the broader market conditions surrounding it.
Learning how to evaluate signals directly on a trading chart can help traders examine the setup, confirm supporting evidence, and recognize situations where a signal may lack sufficient context.
A trading chart provides more than entry and exit points. Price movement, trend direction, volume, support and resistance, and technical indicators can all provide information about the conditions behind a potential setup.
Reviewing these elements together, including key price action concepts, can make the evaluation process more systematic instead of relying on a single signal.
In this blog, we will cover what a trading chart shows and why its different elements matter when evaluating signals. We will also walk through seven practical steps for reviewing signals directly on a chart.
What Is a Trading Chart?
A trading chart is a visual representation of price movement for a financial asset over a selected period. It can display information such as open, high, low, and closing prices, while additional tools can help traders study momentum, volatility, volume, and market structure.
Charts can use different timeframes, including one-minute, hourly, daily, or weekly intervals. The timeframe selected affects how a trader interprets a signal because a setup appearing on a short-term chart may occur within a completely different trend on a higher timeframe.
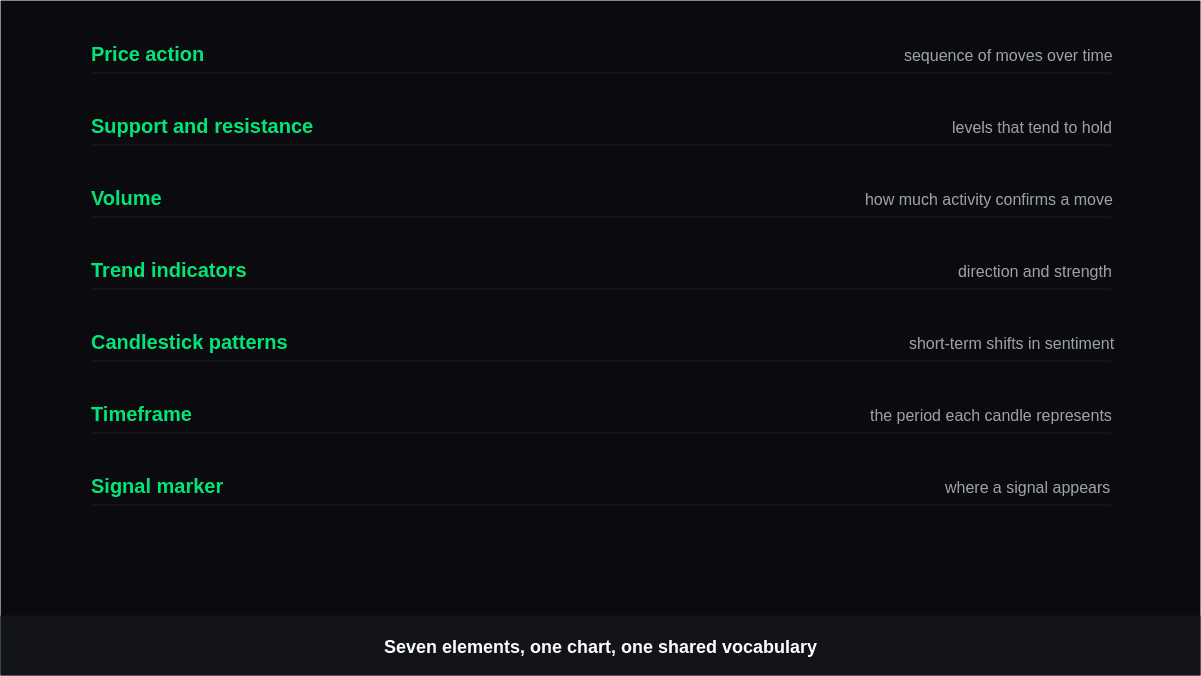
| Chart Element | What It Can Help You Examine |
|---|---|
| Price action | Direction and recent movement |
| Support and resistance | Important reaction areas |
| Volume | Participation behind price movement |
| Trend indicators | Direction and momentum |
| Candlestick patterns | Short-term buying or selling behavior |
| Timeframe | Context and trade duration |
| Signal marker | Potential entry or exit condition |
Understanding these elements gives traders a foundation for evaluating whether a signal fits the current market environment.
7 Steps to Evaluate Signals on a Trading Chart
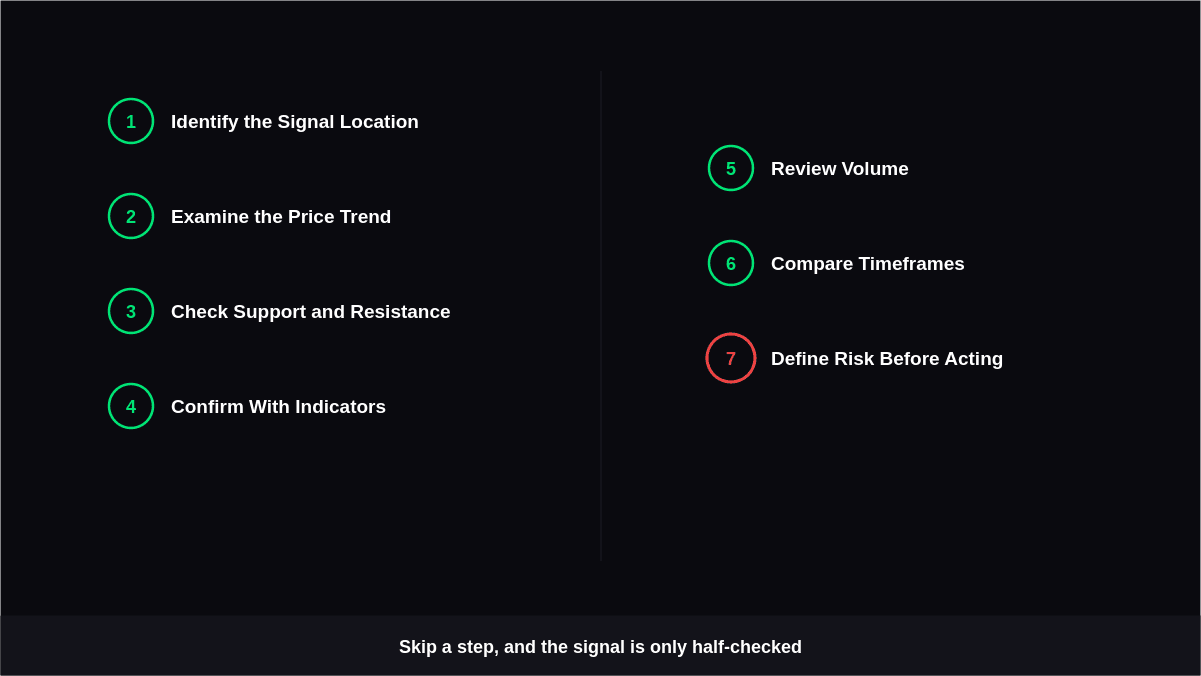
A signal should be treated as a starting point for analysis rather than the entire decision-making process. The following steps provide a structured way to examine what is happening around a potential setup.
1. Identify the Signal Location
Start by examining exactly where the signal appears on the chart.
- Check whether the signal occurs after a sustained move.
- Note whether it appears near a recent high or low.
- Look for nearby support or resistance levels.
- Determine whether the signal appears during consolidation or directional movement.
The location can provide important context because the same signal may have different implications depending on where it occurs within the price structure.
2. Examine the Current Price Trend
Next, determine whether the broader price movement is bullish, bearish, or relatively range-bound.
- Look at the sequence of recent highs and lows.
- Check whether the price is making higher highs and higher lows.
- For a bearish environment, examine lower highs and lower lows.
- Consider whether the signal agrees with or moves against the prevailing direction.
This step helps distinguish signals that align with the current market structure from those that occur against it.
3. Check Nearby Support and Resistance
Price often reacts around previously significant areas, making these levels useful when reviewing trading signals.
- Mark recent swing highs and swing lows.
- Identify areas where price has repeatedly reversed.
- Check whether a signal occurs close to a major level.
- Observe whether price breaks through a level or rejects it.
A buy signal near established support may present a different setup from one appearing directly below strong resistance. The surrounding price structure should therefore be considered before interpreting the signal.
4. Confirm With Technical Indicators
Indicators can provide additional information about momentum, trend, or market conditions.
- Use momentum indicators to examine the strength of a move.
- Compare trend indicators with the direction of price.
- Avoid relying on several indicators that measure essentially the same condition.
- Check whether indicator readings support or contradict the chart setup.
The purpose is not to collect as many indicators as possible. Instead, use selected technical indicators to answer specific questions that price action alone may not clearly answer.
5. Review Volume and Market Participation
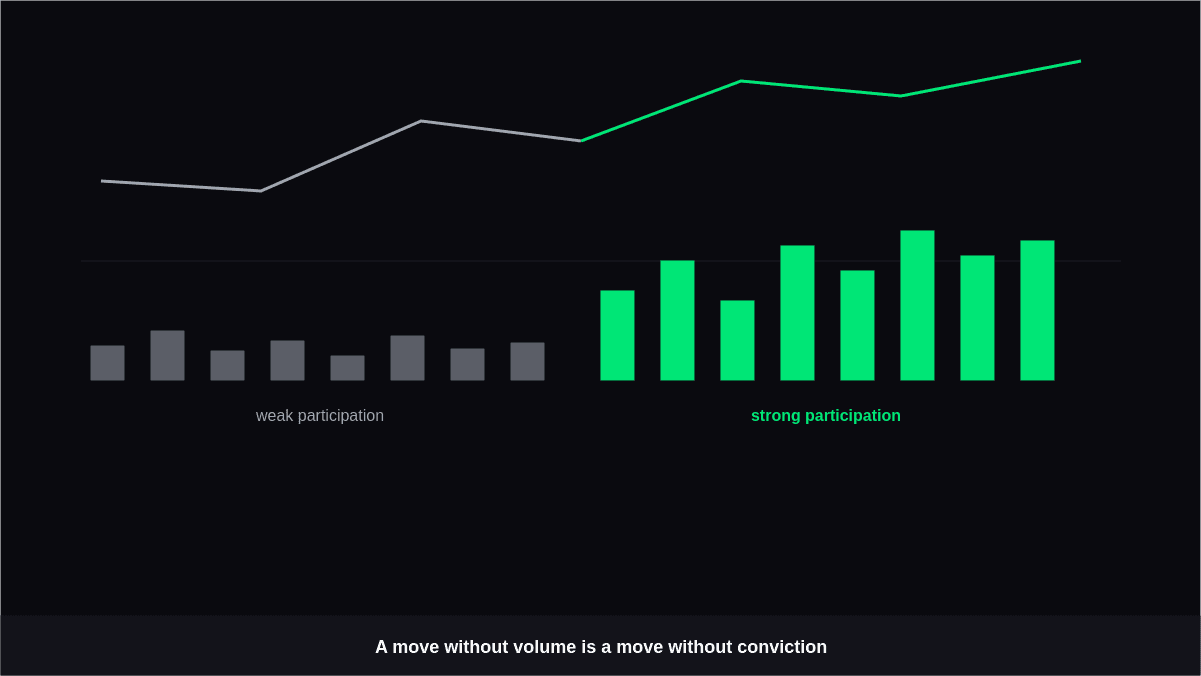
Volume can help traders understand whether meaningful participation accompanies a price movement.
- Compare current volume with recent activity.
- Look for increased participation around significant breakouts.
- Examine whether price is moving while volume remains unusually weak.
- Consider whether volume behavior supports the direction of the signal.
Volume does not automatically validate a setup, but it can add useful context when combined with price behavior and other chart information.
6. Compare Multiple Timeframes
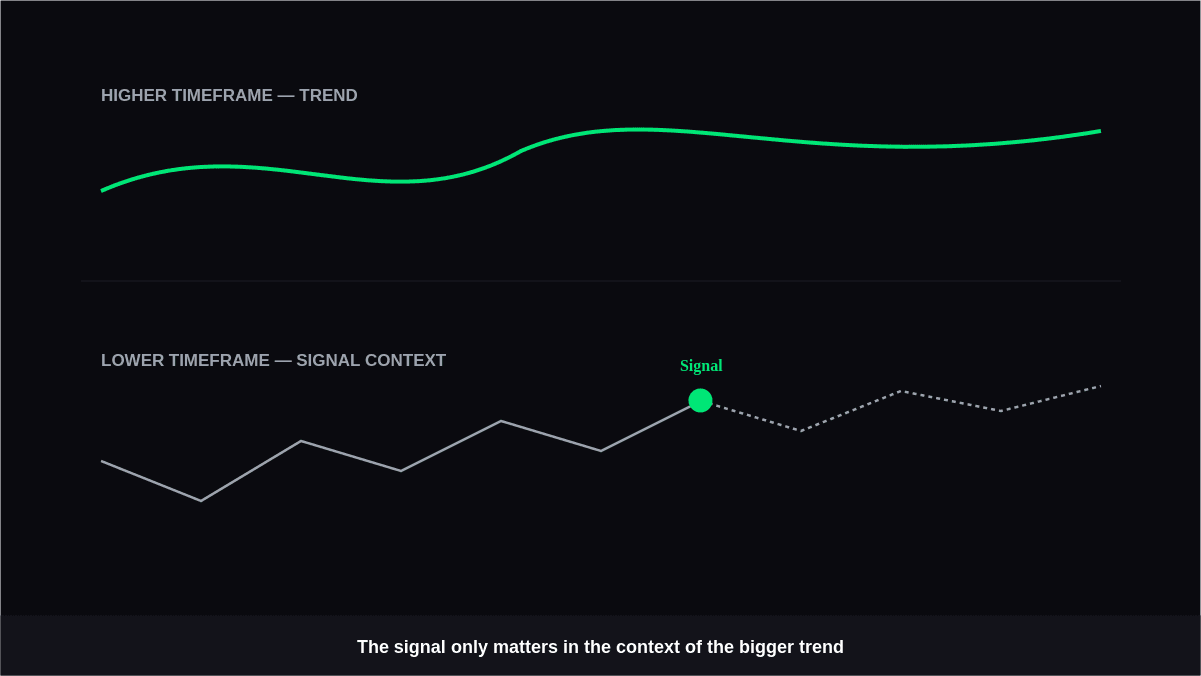
A signal becomes easier to interpret when viewed within a broader timeframe.
- Check a higher timeframe for the dominant market direction.
- Use the trading timeframe to study the specific setup.
- Avoid assuming that a short-term reversal changes the larger trend.
- Compare important support and resistance zones across timeframes.
For example, a bullish setup on an hourly chart may occur during a larger daily downtrend. Recognizing that relationship gives the trader additional context before deciding how to interpret the signal.
7. Define Risk Before Acting on the Signal
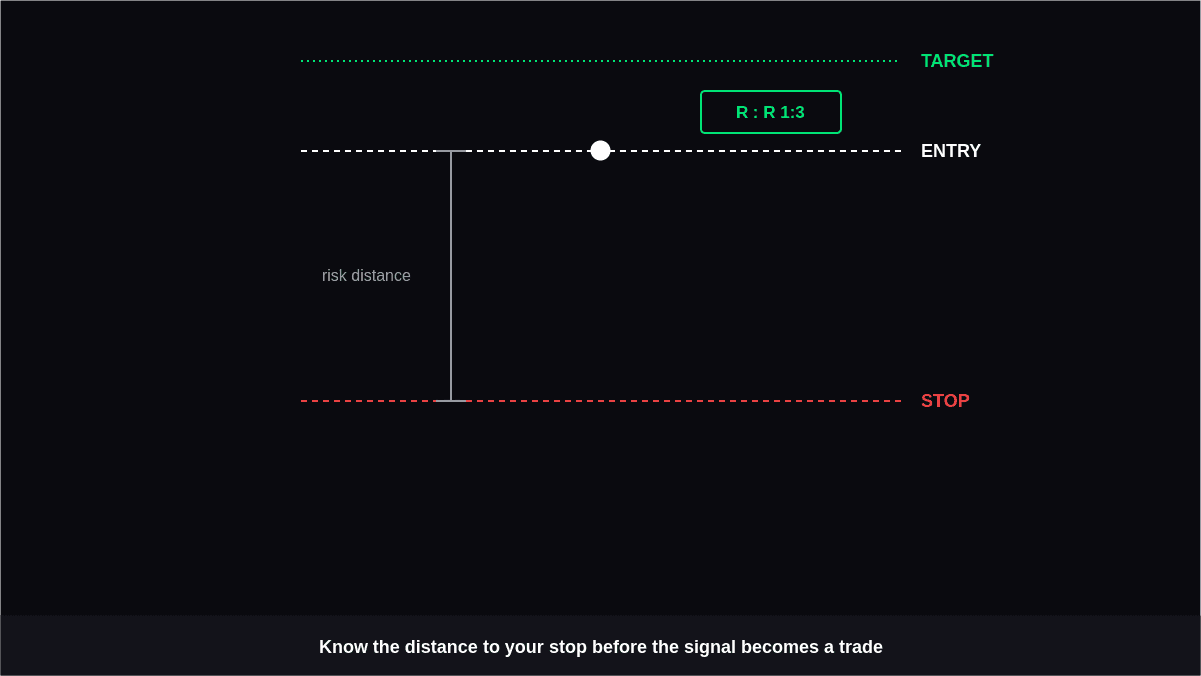
The final step is to consider what happens if the setup fails.
- Identify a logical level where the trade idea would no longer be valid.
- Estimate the potential distance to the intended target.
- Consider position size relative to the planned risk.
- Avoid treating a signal as a guarantee of future price movement.
Risk evaluation separates signal recognition from trade execution. A technically interesting setup may still be unsuitable if the potential risk cannot be clearly defined.
Building a Consistent Chart Evaluation Process
A repeatable chart analysis process can reduce the tendency to make decisions based on one visually attractive signal. Instead of asking only whether a marker says buy or sell, traders can review the signal location, market structure, key levels, indicator evidence, volume, timeframe context, and risk.
Keeping the process consistent also makes it easier to compare different setups. Over time, traders can record which conditions were present when signals appeared and review how those setups behaved afterward. This can provide a more structured basis for evaluating a trading approach.
Conclusion
Learning to evaluate signals directly on a trading chart involves more than identifying a buy or sell marker. Traders can examine price structure, important levels, volume, indicators, multiple timeframes, and risk conditions to develop a fuller view of the setup.
The goal is not to make every signal appear valid. Instead, careful chart analysis helps traders understand the circumstances surrounding each setup and identify what information supports or challenges the signal.
A consistent evaluation process can make chart-based decision-making more deliberate and easier to review, especially when assessing how technical indicators support or challenge a potential setup.