A trading model can produce impressive backtest results and still fail in live markets. Data Leakage is one reason this happens. It occurs when information that would not have been available at the time of a trading decision enters the model, feature set, validation process, or evaluation. This can make a strategy appear more predictive than it really is.
Detecting leakage requires more than searching for an obvious future price in the dataset. Traders and developers need to examine feature timing, labels, duplicate observations, repainting behavior, historical data revisions, validation design, and execution assumptions.
Proper in-sample vs out-of-sample testing can help reveal whether a model is relying on information that would not have been available when the original trading decision was made.
In this blog we will explore what data leakage actually means in a trading model and how to detect it.
What Data Leakage Means in a Trading Model
Data Leakage occurs when information crosses the time boundary that should separate what was known from what was not yet known.
Consider a model generating a signal at 10:00. Any feature used for that decision should be based only on information available by 10:00. If a calculation accidentally incorporates data from 10:05, the model has received information from the future.
Leakage can enter through several parts of a trading workflow:
- Features calculated with future observations
- Labels accidentally included in model inputs
- Preprocessing performed before splitting the dataset
- Duplicate or overlapping observations across splits
- Revised historical information
- Incorrectly adjusted market data
- Current index constituents applied to historical periods
- Random validation methods that ignore temporal dependence
The key question is therefore not simply whether a feature contains a future price. It is whether the model could have obtained that information at the exact moment the trading decision was supposed to occur.
Audit When Every Feature Became Available
A useful starting point is to create an availability timeline for every input.
| Data Element | What It Represents | When It Can Be Used |
|---|---|---|
| Previous candle close | Completed market information | After that candle closes |
| Current candle price | Developing market information | Live execution setup |
| Earnings result | Company financial information | After public release |
| Economic indicator | Macroeconomic information | After release |
| Rolling indicator | Calculation of historical observations | Required observations exist |
The important distinction is between observation time and availability time.
For example, an earnings report may describe financial activity from a previous quarter, but those figures were not available to traders during that quarter. Likewise, a dataset may contain a historical value that was later revised.
Documenting both timestamps makes it easier to identify features that look historically valid but could not actually have been known when the strategy was traded.
Run Four Direct Tests for Hidden Leakage
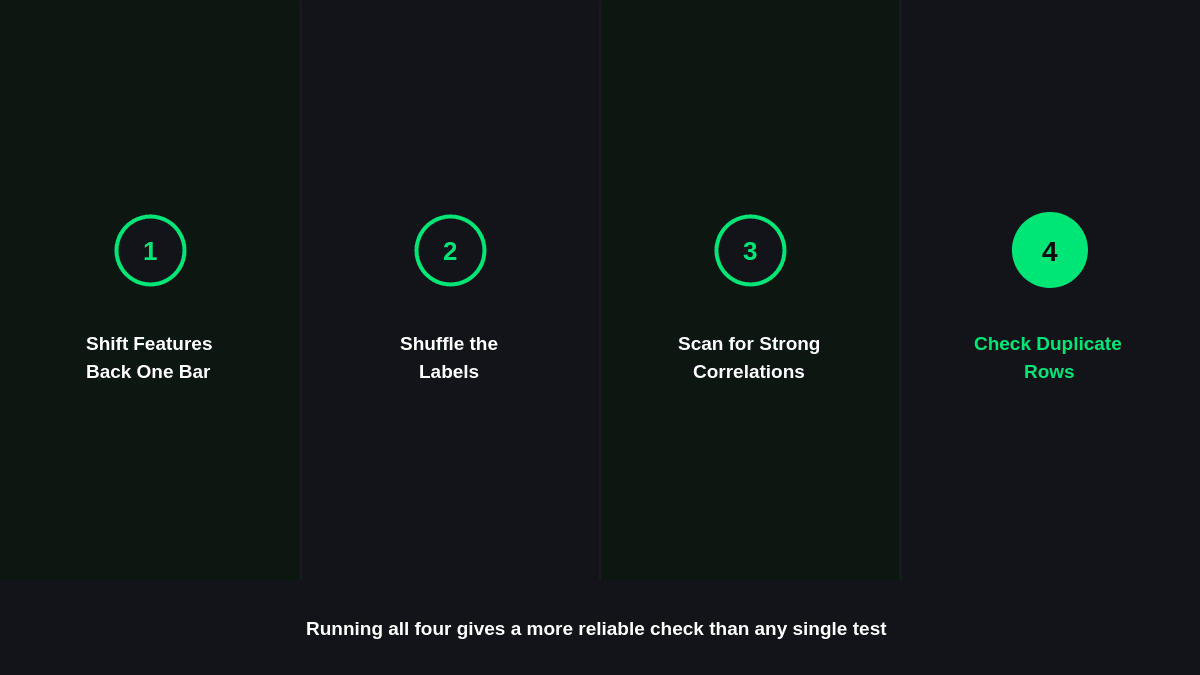
Hidden leakage often becomes easier to identify when the model is tested under controlled conditions. Instead of relying only on feature definitions, change one part of the dataset or evaluation process at a time.
These tests can reveal whether the model is benefiting from information that would not be available at the moment of prediction.
Running all four tests provides a more reliable check than relying on a single warning sign.
1st Test: Shift Features Back One Bar
Take potentially problematic features and shift them back by one bar before rerunning the model or backtest.
If the original version performs dramatically better than the delayed version, investigate why. The difference may indicate that the original calculation was using information from the wrong point in time.
This test is particularly useful for rolling indicators, engineered features, signal calculations, and transformations involving candle data.
2nd Test: Shuffle the Labels
Randomly shuffle the target labels while keeping the feature data unchanged.
The model should lose most of its predictive relationship because the original connection between inputs and outcomes has been destroyed.
Unexpectedly strong performance after label shuffling warrants an investigation into the pipeline. Possible causes include duplicated information, target contamination, an implementation mistake, or another hidden dependency.
3rd Test: Scan for Implausible Feature-Target Correlations
Calculate the relationship between individual features and the target variable.
An unusually strong correlation can be a warning sign, especially when the feature has no reasonable economic or market explanation for predicting the target.
Correlation does not prove leakage by itself. Some legitimate features can have strong relationships with an outcome. The purpose of this test is to identify inputs that deserve deeper investigation.
4th Test: Check for Duplicate Rows Across Splits
Search training, validation, and test datasets for identical or near-identical observations.
Duplicates can occur because of faulty joins, repeated records, overlapping data windows, or dataset construction errors. If substantially the same information appears in both training and evaluation data, the model may effectively be tested on information it has already encountered.
This test should include both exact duplicates and, where appropriate, observations that share the same underlying market event.
Test Repainting and Look-Ahead Behavior
Repainting creates a different kind of timing problem. An indicator may display a historical signal that later changes when additional price information becomes available.
This is closely related to look-ahead bias, where future information influences a historical decision.
A common trading example is evaluating an indicator on the current forming bar instead of the last confirmed bar.
Suppose a strategy shows a buy signal while a candle is still forming. Price can change before that candle closes, causing the indicator conditions to disappear or move. If a backtest records the signal as though it were permanently known at that earlier moment, its results may benefit from information that was only established later.
Test this by:
- Generating signals only from confirmed candles.
- Comparing them with signals produced during candle formation.
- Recording exactly when the signal first became actionable.
- Rerunning the strategy using confirmed-bar logic.
A significant difference between these versions deserves investigation before the original backtest is trusted.
Verify That Historical Data Is Truly Point-in-Time
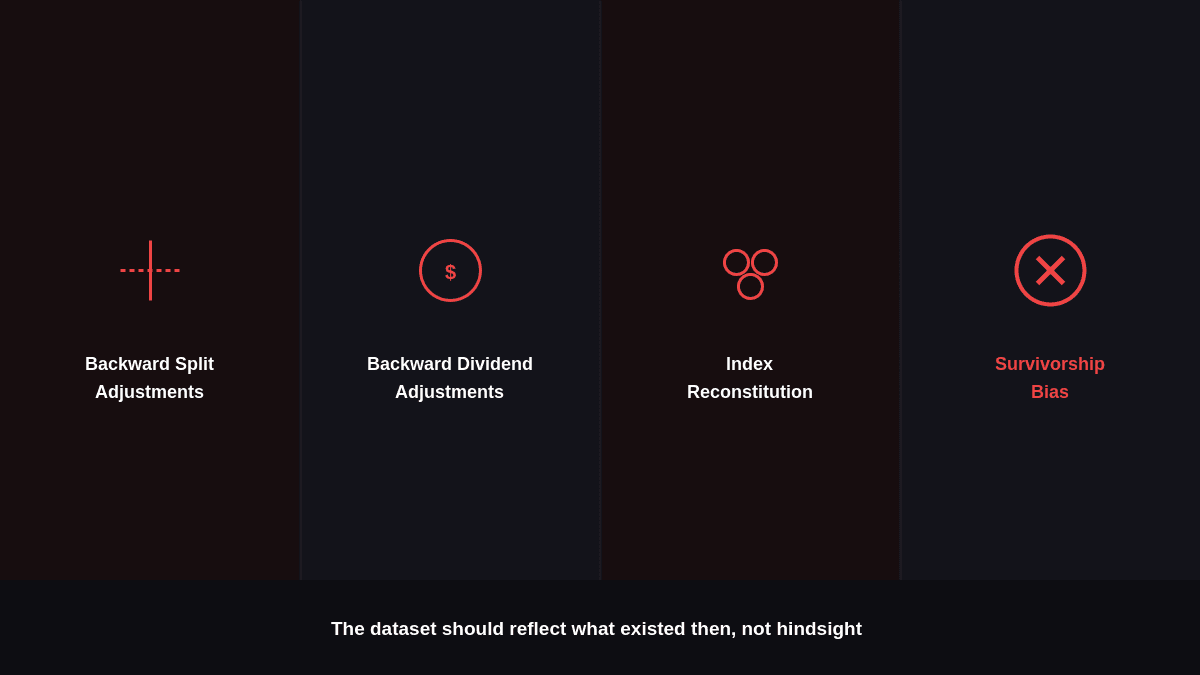
Point-in-time data is particularly important when a trading model uses fundamental, index, or corporate information.
A historical dataset can contain today's knowledge about yesterday's market. That creates a subtle form of leakage even when no future price appears in the feature set.
Check for these sources:
- Restated fundamentals: financial statements can be revised after their initial publication.
- Backward-applied split adjustments: vendors may recalculate historical prices after a later stock split.
- Backward-applied dividend adjustments: historical series may incorporate later dividend information.
- Index reconstitution: a current list of index constituents may incorrectly be applied to earlier periods.
- Survivorship bias: companies that were delisted, acquired, or went bankrupt may disappear from a historical universe.
For a realistic backtest, the dataset should represent the information and asset universe that existed at that historical point, rather than information reconstructed with hindsight.
Account for Overlapping Observations
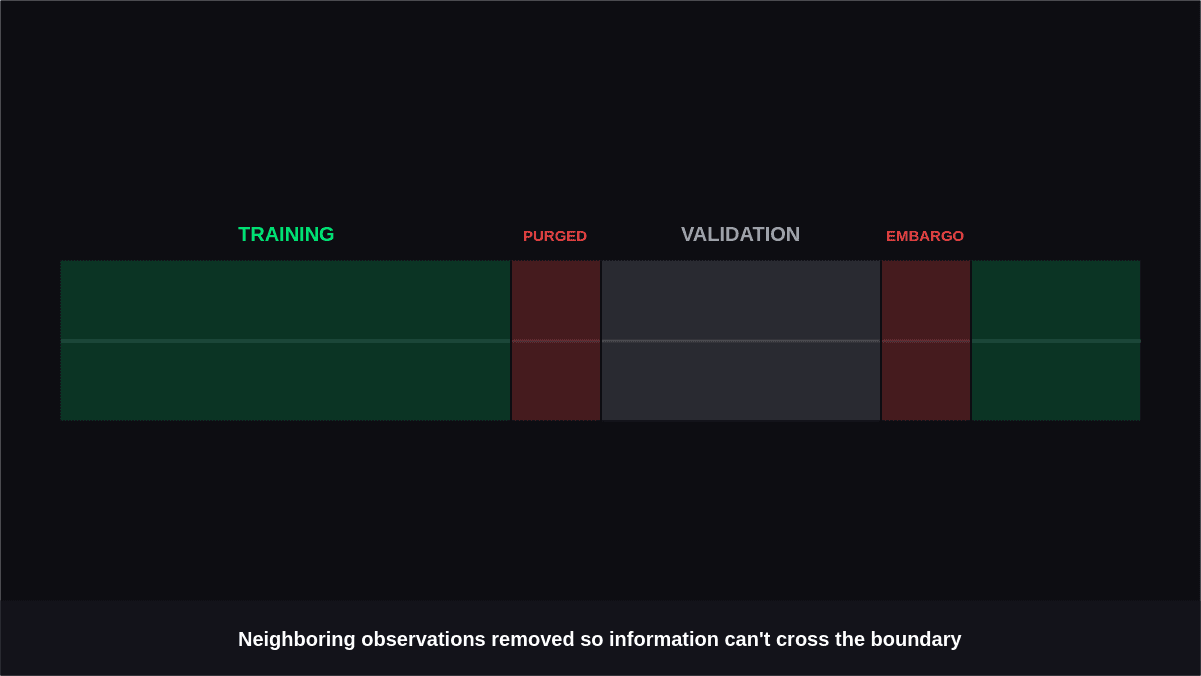
Financial observations often depend on neighboring periods.
For example, a model may use the previous 20 bars as features and predict the next 10 bars. If another observation is generated shortly afterward, its feature and target windows may overlap with the first observation.
A random split can place related observations in different datasets, allowing information from one period to indirectly influence another.
Purged K-fold cross-validation can help address this problem. Observations that overlap with the validation period are removed from the training portion rather than being allowed to remain there.
An embargo period provides additional separation after the validation window. This prevents nearby observations from immediately re-entering the training set when their information may still be related to the validation sample.
The appropriate purge and embargo lengths depend on the model's lookback period, forecast horizon, and data structure.
Check Preprocessing for Information From the Future
Leakage can enter before the model is even trained.
Suppose a dataset is standardized using the mean and standard deviation of the entire historical sample. Information from the eventual validation or test period has then influenced the transformation applied to the training data.
The same concern applies to:
- Feature selection
- Imputation
- Outlier treatment
- Normalization
- Dimensionality reduction
- Hyperparameter selection
A safer sequence is:
Training data → Fit transformation → Apply to validation/test data
The transformation should learn its parameters from the training period rather than from the complete dataset.
Compare Backtest Timing With Real Execution
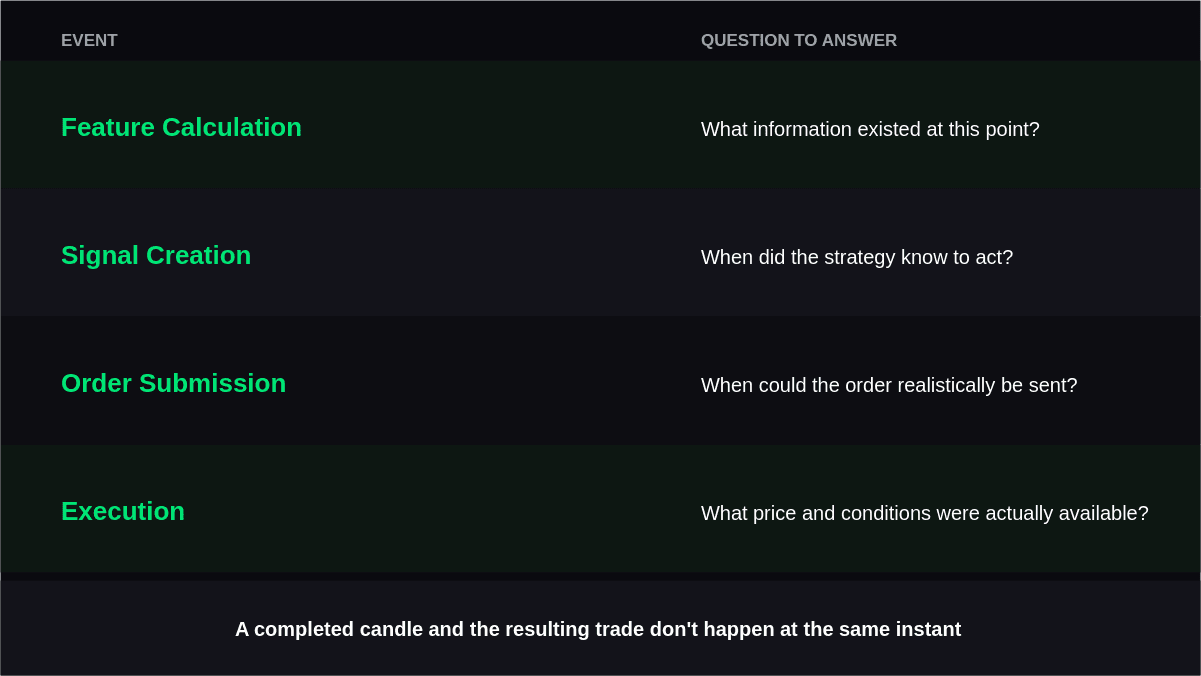
Even clean features and validation can produce misleading results if the backtest assumes impossible execution.
For every trade, establish four separate timestamps:
| Event | Question to Answer |
|---|---|
| Feature calculation | What information existed at this point? |
| Signal creation | When did the strategy know it should act? |
| Order submission | When could the order realistically be sent? |
| Execution | What price and market conditions were actually available? |
For example, a strategy may calculate a signal using a candle's closing price and then assume an entry at that same close. In live trading, the strategy cannot generally submit an order before knowing the final close.
The backtest therefore needs to reflect the actual sequence rather than treating a completed candle and the resulting trade as though they occurred simultaneously.
Follow a Structured Leakage Audit
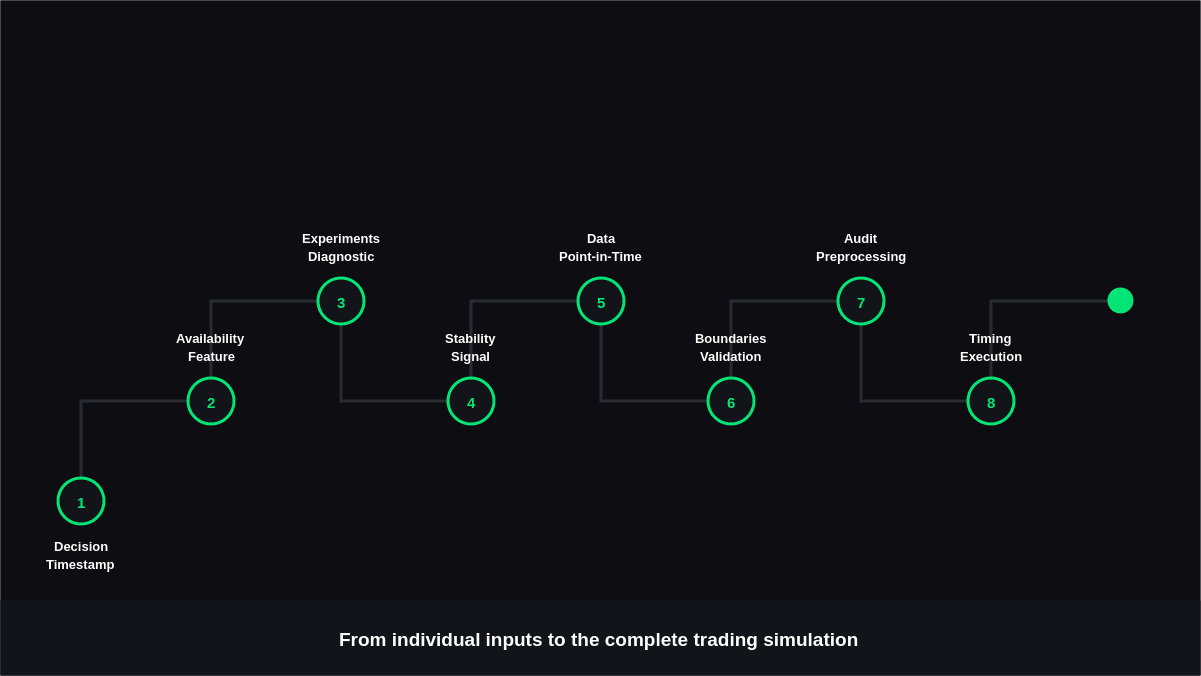
Once the individual checks are understood, they can be applied in a consistent order:
1. Establish the decision timestamp
Define exactly when the model is expected to make each prediction.
2. Map feature availability
Record when every input became known.
3. Run the four diagnostic experiments
Shift features, shuffle labels, inspect feature-target relationships, and search for duplicate observations.
4. Test signal stability
Compare confirmed-bar signals with signals generated from unfinished candles.
5. Reconstruct historical information
Verify fundamentals, corporate actions, index membership, and the asset universe using point-in-time data.
6. Review validation boundaries
Identify overlapping observations and apply purging or embargo periods where appropriate.
7. Audit preprocessing
Make sure transformations are fitted using only information available in the relevant training period.
8. Reconcile execution timing
Confirm that signal generation, order submission, and assumed fills follow a realistic sequence.
This workflow moves from the individual data inputs to the complete trading simulation without relying on a single leakage test.
Why Clean Evaluation Matters
The purpose of leakage detection is not to make a backtest less impressive. It is to determine whether its results represent a process that could have existed in real time.
A model can achieve excellent historical metrics because it has learned genuine market relationships, but those metrics can also be inflated when information has crossed a temporal boundary.
Reliable evaluation therefore depends on controlling when information enters the system, making backtesting vs. forward testing an important consideration rather than simply measuring how accurately the model predicts historical outcomes.
Conclusion
Data Leakage is best detected by treating time as a strict boundary throughout the entire trading pipeline. A reliable audit should establish feature availability, run controlled leakage tests, check confirmed-bar behavior, verify point-in-time datasets, account for overlapping observations, isolate preprocessing, and compare backtest timing with realistic execution.
The strongest validation process is therefore not the one that produces the highest historical score.
It is the one that ensures every input, transformation, prediction, and trade uses only information that would genuinely have been available at that moment, which is essential to validate trading strategies.