A TradingView indicator may look highly accurate on historical charts, but its signals can sometimes change after new market data appears. If you want to know how to check if a TradingView indicator repaints, you need to test how its signals behave in real-time rather than relying only on past performance. Repainting can cause buy and sell signals to disappear, move to different candles, or appear more accurate than they were when the market was live.
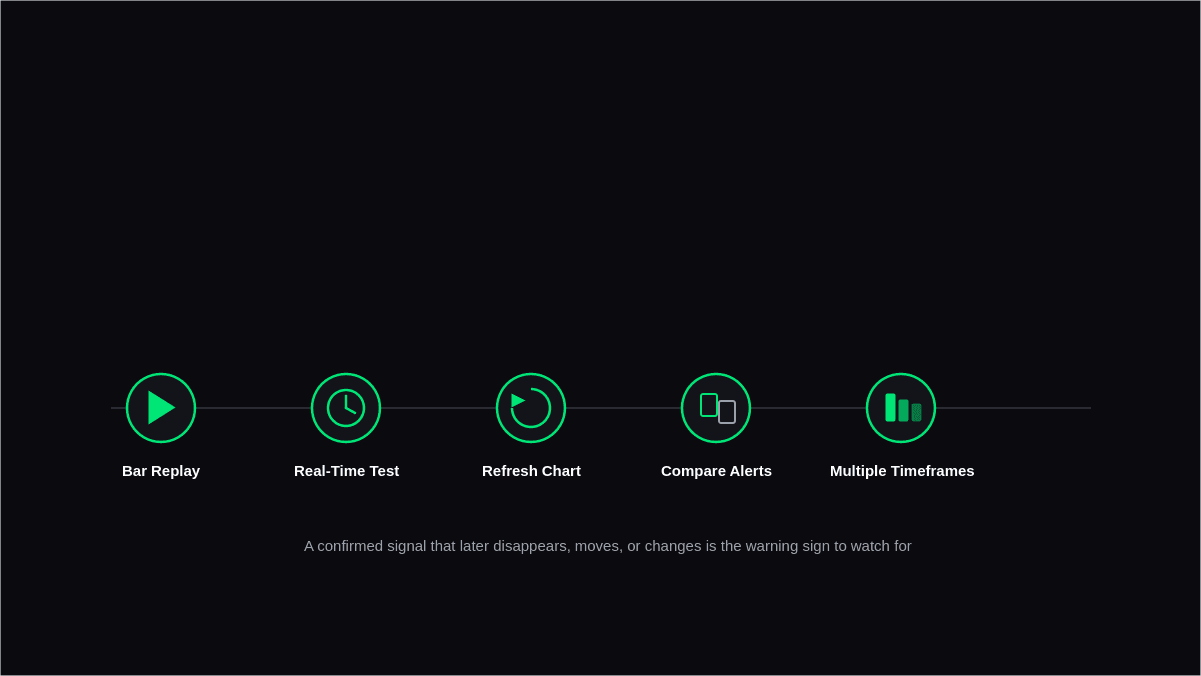
Fortunately, you can verify an indicator using practical methods such as TradingView Bar Replay, real-time monitoring, chart refreshes, alerts, screenshots, and multiple timeframe testing. These checks are especially useful when evaluating a buy/sell signal indicator for live trading.
This guide explains what repainting means, why it happens, and how to determine whether an indicator's historical signals remain stable after candles close.
Quick Answer
To check if a TradingView indicator repaints:
- Use Bar Replay and watch signals appear candle by candle.
- Test the indicator in real time and wait for candles to close.
- Refresh the chart and check if past signals have changed.
- Compare alerts and screenshots with historical signals.
- Test the indicator across different timeframes.
If a signal that appeared on a completed candle later disappears, moves, or changes, the indicator may be repainting. Changes while a candle is still forming are usually normal.
What Does "Repainting" Mean in TradingView?
Repainting is defined as an occurrence where the indicator changes previously drawn signals and values once more data is available from the market.
For instance, an indicator can give a buy signal on yesterday's candle. Once more candles are formed, the buy arrow is no longer there or it is transferred to some other candle. When observing this indicator purely in terms of its historical data, it seems to be predicting the markets perfectly since it gave a different signal initially.
This phenomenon tends to set unrealistic expectations since charts with historical data no longer show what traders were seeing at the moment when the market was live.
Confirmed vs. Unconfirmed Candles
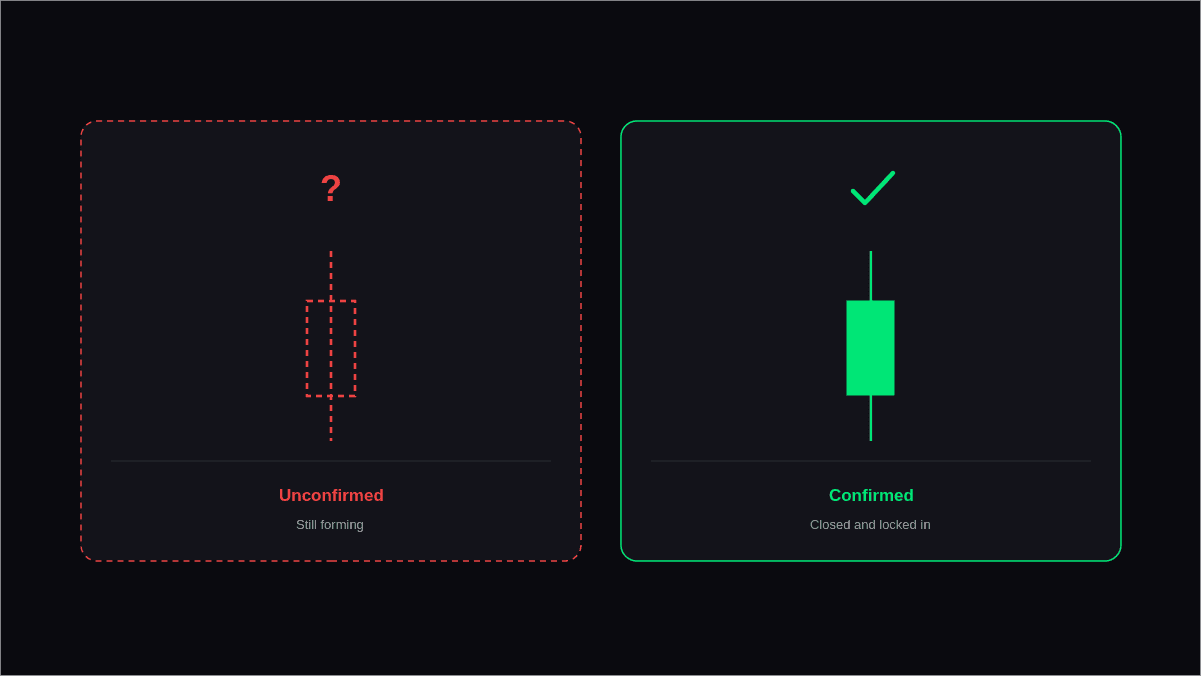
For a candle that is not yet completed, its:
- High
- Low
- Close
- Volume
can all change.
There are many indicators which can be changed dynamically during this time since the candle is not yet complete. Once the candle completes, the indicator's signal will normally stay the same.
A change during the formation of a candle is usually normal and does not automatically mean the indicator is repainting. A change after the candle has closed requires further investigation.
Repainting vs. Lag: What's the Difference?
Repainting and lag are two different indicator behaviors and should not be confused. Here’s a quick view of the key differences between repainting and lag:
| Factor | Repainting | Lag |
|---|---|---|
| What Happens? | Earlier signals can be modified when new price data enters the calculation. | The indicator takes additional time to confirm a price move. |
| Effect on past signals | A signal may shift, disappear, or change after the candle has closed | Previous signals generally remain unchanged once confirmed. |
| Timing | May appear accurate in hindsight because the indicator can revise earlier readings. | The signal comes after the market has already made part of the move. |
| Main Concern | Can make historical results look more reliable than they were in real time. | Can result in entering a trade later than ideal. |
| Does it mean the indicator is faulty? | Frequent or unexplained repainting can be a serious reliability concern. | Not necessarily; some lag is an intentional part of indicator design. |
| Easy way to remember | Repainting = the past can change. | Lag = the signal arrives late. |
Why Do TradingView Indicators Repaint?
TradingView indicators can repaint for several technical reasons. Repainting does not always mean that a developer intentionally created a misleading tool.
Below are the most frequent causes of repainting.
Using Future Price Data
Indicators either unintentionally or purposefully use data which was unavailable at the time of the original signal appearance. As future candles affect the calculation of past values, the original signals seem significantly more precise. According to official Pine Script documentation on repainting, using lookahead calculations is one of the most frequent causes of misleading historical results.
Higher Timeframe Data
Indicators which employ higher time frame data sometimes have to wait for the higher time frame candles to close.
Such as:
- 5-minute chart
- Using a 1-hour moving average
Hourly candles continue to update for sixty minutes. Since the indicator employs incomplete higher time frame data, initial indications can get revised.
Signals Generated Before Candle Close
Many indicators try to give entries before there is candle confirmation. While this will make your signals quicker, it also makes the probability of your signals vanishing higher if the price turns around before there is candle confirmation. This is why traders should distinguish between a signal changing on an active candle and a confirmed signal changing after the candle has closed.
Poor Indicator Design
Some custom indicators just have faulty programming altogether. Common problems in code are:
- Future-looking
- Wrong use of request.security()
- Problems with live bars
- Lookahead enabled
These programming problems can cause the indicator to seem very accurate when backtested but behave erratically in live markets. Understanding how modern trading indicators process market data can also help traders evaluate their reliability.
Step-by-Step Guide: How to Verify a TradingView Indicator for Repainting
It is best to test the indicator based on an environment similar to live trading rather than using just the historical chart.
Here are some ways for you to figure out if your signals are still consistent even after getting new market data.
Step 1: Perform a TradingView Bar Replay Test
One of the best methods for detecting repainting is the TradingView Bar Replay test.
Rather than looking at the completed chart, you can use Bar Replay to uncover candles one by one as the market would have played out in reality.
While doing the Bar Replay test:
- Open the chart.
- Activate Bar Replay.
- Choose a starting point before major price movement.
- Advance one candle at a time.
- Record every buy or sell signal as it appears.
Pay particular attention to whether confirmed signals remain stable as new candles appear. Changes to confirmed signals may indicate repainting.
Step 2: Watch the Indicator in Real Time
Charts from history will never show you the whole picture. To understand the indicator correctly, you need to see how it acts in real-time mode when the new candle is being formed.
During this test, observe whether signals change while the candle is still forming and whether they remain stable once the candle closes. Temporary changes on an active candle are common because price and other market data are still changing.
The important question is whether a confirmed signal changes after the candle has closed.
Step 3: Refresh the Chart
Updating the chart is an easy process that helps detect repainting on the part of an indicator.
Once the indicator has been observed for some time:
- Take a screenshot of the chart.
- Update the TradingView website.
- Rerun the indicator.
- Compare the updated chart with your screenshot.
Check whether any previously confirmed signals or indicator values have changed. If they are different after the refresh, investigate the indicator further before relying on its historical performance.
Step 4: Compare Historical Signals
A very common error traders commit is to believe the existing historical chart without documenting what has happened in real-time.
The alternative is:
- Take screenshots when trading is actually going on.
- Keep the date and time frame.
- Compare the screenshots after some hours or the following day.
If the indicator's historical signals are different from the signals you originally recorded, you have evidence that the indicator may be repainting.
The documentation of your trades through screenshots in your trading journal can point out repainting that may be difficult to notice when looking at just the chart.
Step 5: Test Alerts Instead of Visual Signals
There are cases where visual indicators can be misleading, particularly when the indicator repaints its arrows or labels after the price move.
TradingView alerts serve as another tool for consistency verification.
Set up alerts according to your indicator and observe:
- Whether alerts trigger at the expected time.
- Whether they match the visible chart.
- Whether historical signals align with the alerts that were actually sent.
It is vital for alerts to correspond with candle signals. If there is a discrepancy between alerts and historical charts, more thorough testing of the indicator is required.
Step 6: Test Multiple Timeframes
Some indicators work nicely in one period but may repaint on others, especially when the indicator is based on a calculation from a higher timeframe.
Try running the indicator on different periods like:
- 5-minute
- 15-minute
- 1-hour
- 4-hour
- Daily
Compare how the indicator behaves on each timeframe instead of assuming that results from one timeframe apply to all others.
When there is only repainting on certain periods, this could mean that it’s not because of the indicator’s algorithm but the higher timeframe data process.
Step 7: Read the Indicator Documentation
Most developers indicate if the indicator repaints or not.
Before using an indicator:
- Read its description.
- Review update notes.
- Check documentation.
- Look for known limitations.
There are indicators which have been intentionally created by some developers to update constantly till the candle closes.
Some developers also offer TradingView indicators that claim to be non-repainting and explain how their signals are verified
Signs That an Indicator May Be Repainting
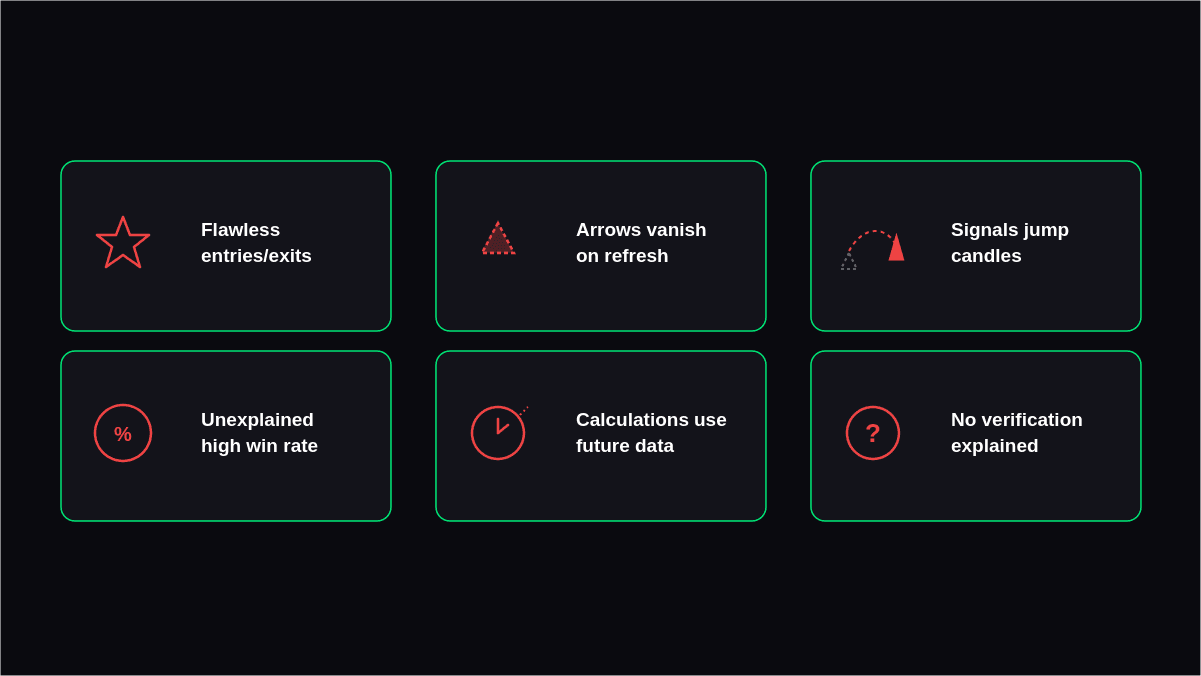
While proper testing is required to be certain of repainting, there are certain warning signs which should alert traders to investigate further.
These include:
- Charts with almost flawless entries/exit entries.
- Buy and Sell arrows vanishing after refreshing a chart.
- Movement of signals from one candle to another.
- High win rates not explained by the developer.
- Calculations based on future events.
- Developers who cannot describe how their signals are verified.
- Tests with unrealistic results compared to real trading.
These signs do not automatically prove repainting, but several appearing together should prompt additional Bar Replay and real-time testing.
Conclusion
Being aware of the ways to check if an indicator repaints on TradingView is a crucial thing to do before adding an indicator to your trading system. A nice-looking chart does not always coincide with the experience that traders had in reality, which means proper verification is necessary.
Instead of judging an indicator solely by its past performance, use practical testing methods such as TradingView Bar Replay, real-time monitoring, chart refreshes, alert comparisons, and multiple timeframe testing. Also remember the difference between repainting and lag: repainting changes previously established signals, while lag simply means a signal appears later than the underlying price movement.
The goal is not simply to find an indicator with attractive historical signals, but to determine whether those signals remain consistent once the market moves forward.
FAQs
Does every TradingView indicator repaint?
No. A lot of indicators calculate after a candle closes, thus historical signals never change. There are also indicators that recalculate on a live candle but will not change when the candle is closed.
Is repainting always bad?
Not necessarily. Some technical indicators deliberately change their values even before the candle completes formation. It could be useful for traders if they were aware of the drawbacks. The main concern is when confirmed historical signals continue changing after the candles have already closed.
How do I know if an indicator uses future price data?
Look for clues such as:
- Unrealistically accurate historical entries.
- Signals moving after a chart refresh.
- Documentation mentioning lookahead calculations.
- Source code using future-dependent logic, if available.
The most reliable approach is still to perform live testing and Bar Replay.
Can Bar Replay detect repainting?
Yes. The Bar Replay feature simulates market conditions candle by candle so that you can know exactly where the signals come from. If confirmed signals change compared with what appeared during the replay, there is a possibility of repainting.
Can TradingView alerts repaint?
Alerts do not repaint even when they are triggered. But if the alert is fired based on the indicator before the candle is confirmed, the alert will not necessarily correspond to the historical chart.