A company's financial results can have a major influence on how investors value its stock. When earnings affect stock prices, the reaction is not based only on whether the company made a profit or loss.
Investors also consider revenue, guidance, profit margins, and how the results compare with expectations. A company can report strong earnings and still see its stock fall if the results were below what the market had already anticipated. Technical indicators can provide additional context when examining how the stock responds to the earnings release.
Understanding this relationship helps beginners interpret why stocks sometimes make large moves after quarterly or annual results.
Why Do Earnings Affect Stock Prices?
Earnings provide investors with information about a company's financial performance and business outlook.
Stronger financial results can support expectations for future growth, while weaker results may cause investors to reassess what the company is worth.
However, the stock market is forward-looking. Investors are often reacting to what the results imply about future revenue, profits, cash flow, and growth rather than simply looking at the numbers from the previous quarter.
For example, a company might report higher profits than it did a year earlier. If investors expected an even larger increase, the stock could still decline because the reported results fell short of those expectations.
What Information Comes in an Earnings Report?
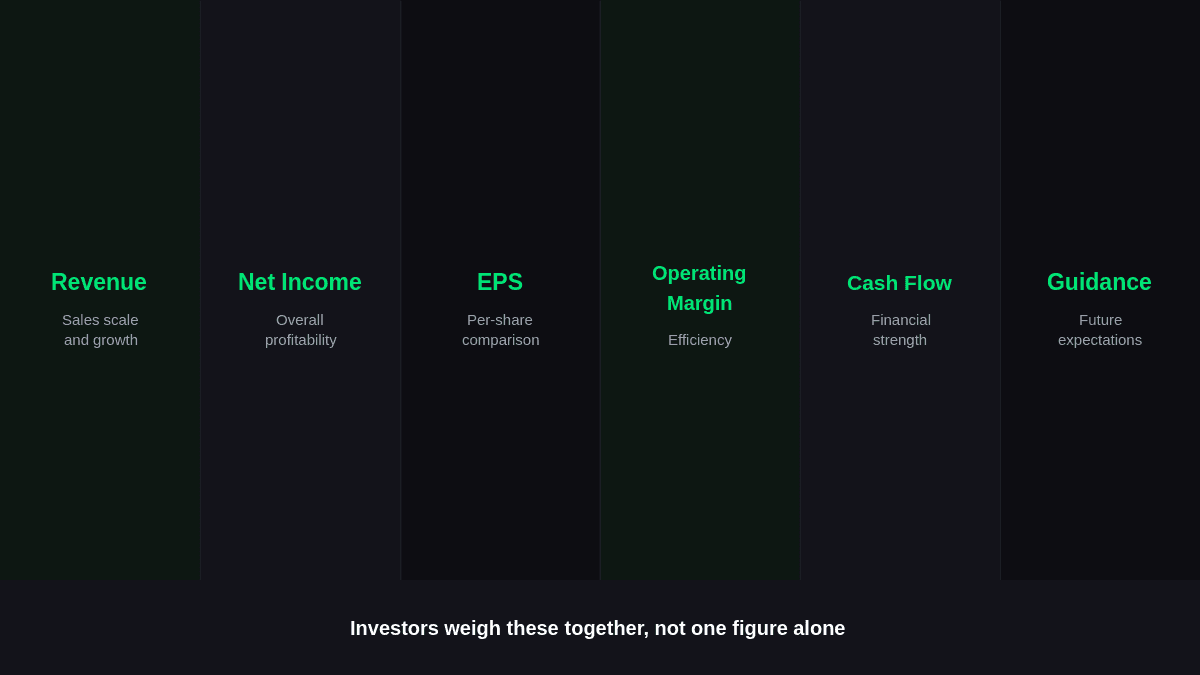
An earnings report gives investors several pieces of information that can influence how they view a company. The exact presentation varies by company, but common figures include:
| Earnings Metric | What It Tells Investors | Why It Matters |
|---|---|---|
| Revenue | How much money the company generated | Shows the scale and growth of sales |
| Net income | Profit remaining after expenses | Indicates overall profitability |
| Earnings per share | Profit allocated to each outstanding share | Helps compare company performance on a per-share basis |
| Operating margin | Profitability from core operations | Shows how efficiently the business operates |
| Cash flow | Cash generated or used by the business | Provides insight into financial strength |
| Guidance | Management's expectations for future results | Can influence expectations about future performance |
Investors generally consider these figures together rather than relying on one number.
How Earnings Per Share Can Move a Stock
Earnings per share, commonly called EPS, represents a company's profit on a per-share basis. It is one of the figures investors commonly examine when evaluating quarterly results.
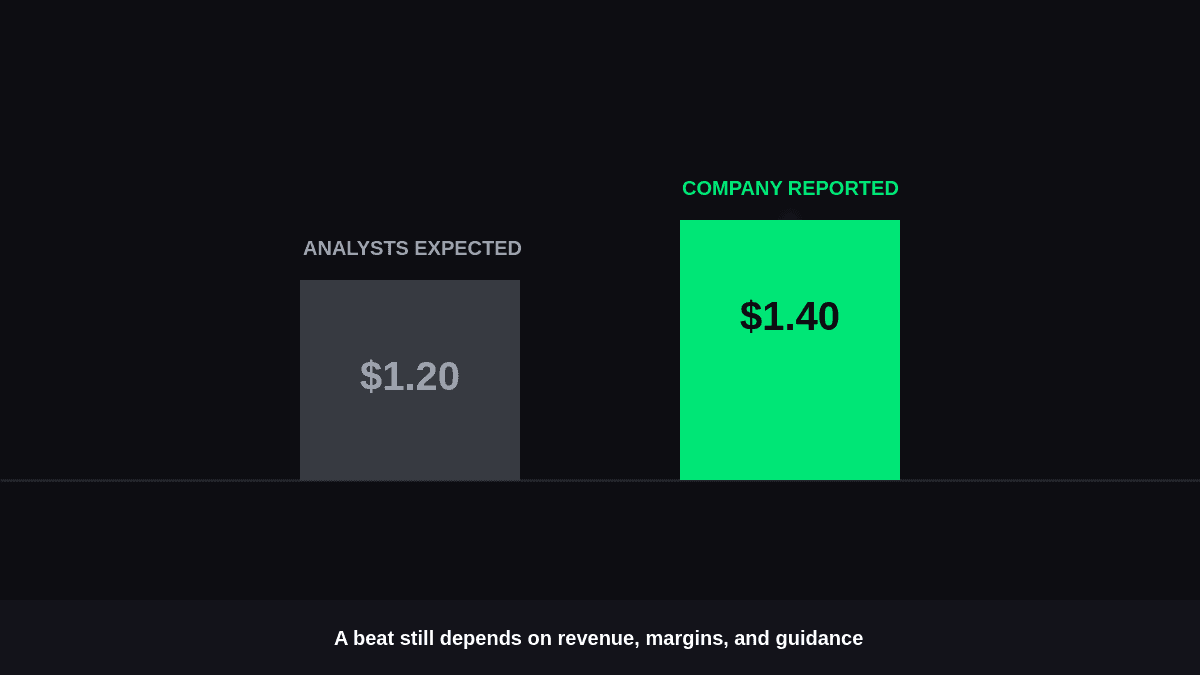
Suppose analysts expect a company to report EPS of $1.20, but the company reports $1.40. On the surface, that may appear positive because the company exceeded the forecast.
The market reaction, however, depends on more than the difference between those two numbers. Investors may also examine revenue growth, margins, future guidance, and whether the improvement came from sustainable business activity or a temporary factor.
EPS is therefore useful as part of the broader earnings picture rather than as a standalone signal for where a stock should move. After the announcement, traders may also monitor support resistance levels to assess how the stock is responding to the results.
What Is an Earnings Surprise?
An earnings surprise occurs when a company's reported results differ from what analysts or the market expected.
There are two basic possibilities:
- Positive surprise: Reported earnings or another important metric comes in above expectations.
- Negative surprise: Reported earnings or another important metric comes in below expectations.
The size of the difference can matter. A small deviation may have a limited effect, while a significant gap can lead to a much larger reassessment of the company's outlook.
A surprise can also involve revenue, margins, guidance, or other important figures. This means investors may react strongly even when headline earnings appear healthy.
How Beginners Can Read Earnings Results
Beginners do not need to analyze every line of a financial statement to understand the basic market reaction. A simple process can provide useful context.
1: Start with the Headline Numbers
Look at the company's key reported figures, including:
- Revenue
- Net income
- Earnings per share (EPS)
2: Compare Results with Expectations
Determine whether the reported figures were:
- Above analyst or market expectations
- Below expectations
- Roughly in line with estimates
3: Check the Company's Outlook
Read management's guidance and comments about future business conditions. Pay attention to factors that could affect upcoming performance.
4: Look Beyond One Quarter
Compare the latest results with previous periods to identify broader trends rather than relying only on a single earnings report.
5: Watch the Market's Reaction
A stock's movement can provide information about how investors interpreted the results. However, the immediate reaction does not necessarily determine the company's long-term performance.
This approach helps separate the reported financial results from the expectations already built into the stock price.
Why a Stock Can Fall After Strong Earnings
A company can announce profitable results and still experience a decline in its share price. This often happens because the market had already priced in stronger performance.
For example:
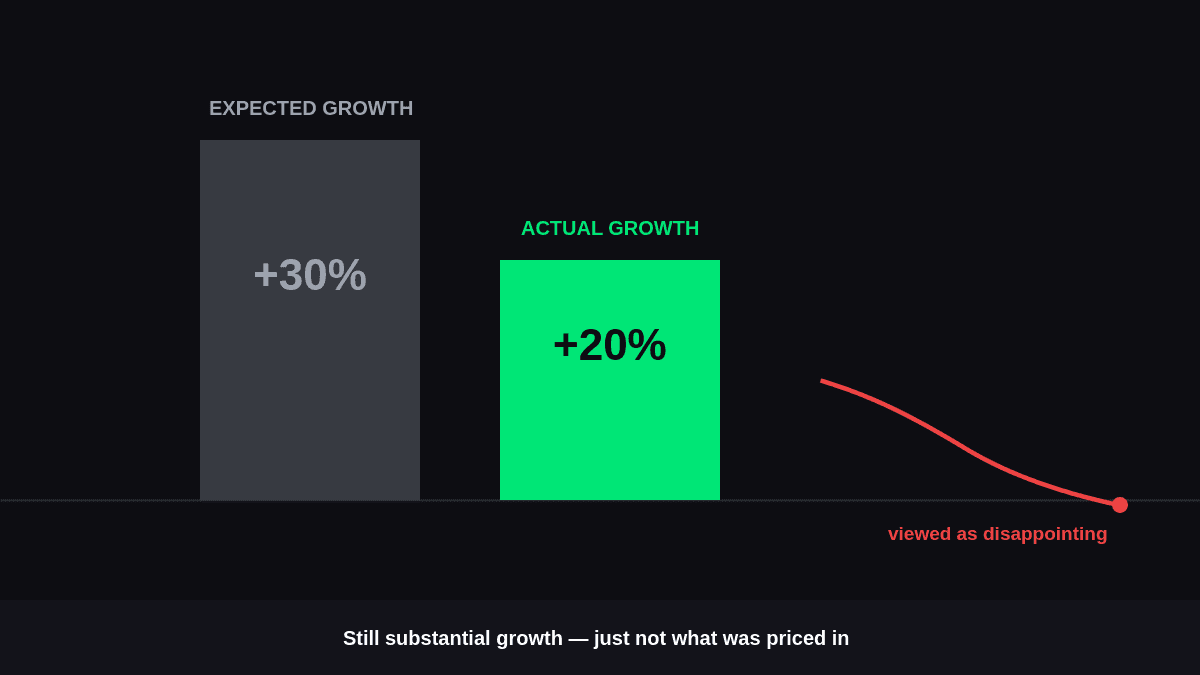
- Expected growth: Investors expected the company’s profits to increase by 30%.
- Actual growth: The company reported a 20% increase in profits.
- Market reaction: Although 20% growth is still substantial, investors may view the result as disappointing because it fell short of expectations.
Another possibility is weaker future guidance. Management may report a strong quarter while warning that upcoming results could be affected by:
- Lower demand
- Rising costs
- Increased competition
- Changes in market conditions
- Other business challenges
This illustrates an important point: stock prices respond to the difference between actual performance and expectations, not simply whether the reported numbers look good in isolation.
How Guidance Changes Investor Expectations
Current earnings describe what happened, while guidance provides insight into what management expects to happen next.
Companies may provide forecasts for future revenue, earnings, margins, capital spending, or other operating measures. Investors can compare these projections with their existing expectations.
If management raises its outlook, investors may revise their estimates of future performance. If guidance is reduced, they may reassess expected growth or profitability.
Guidance can therefore become particularly important when the latest quarter was strong but the company's outlook has changed.
The Role of Revenue and Profit Margins
Earnings are only one part of a company's financial performance. Revenue growth and profit margins can provide additional context.
A company might report higher earnings because of a temporary reduction in expenses, even though sales growth remains weak. Conversely, revenue may increase quickly while rising costs prevent profits from growing at the same pace.
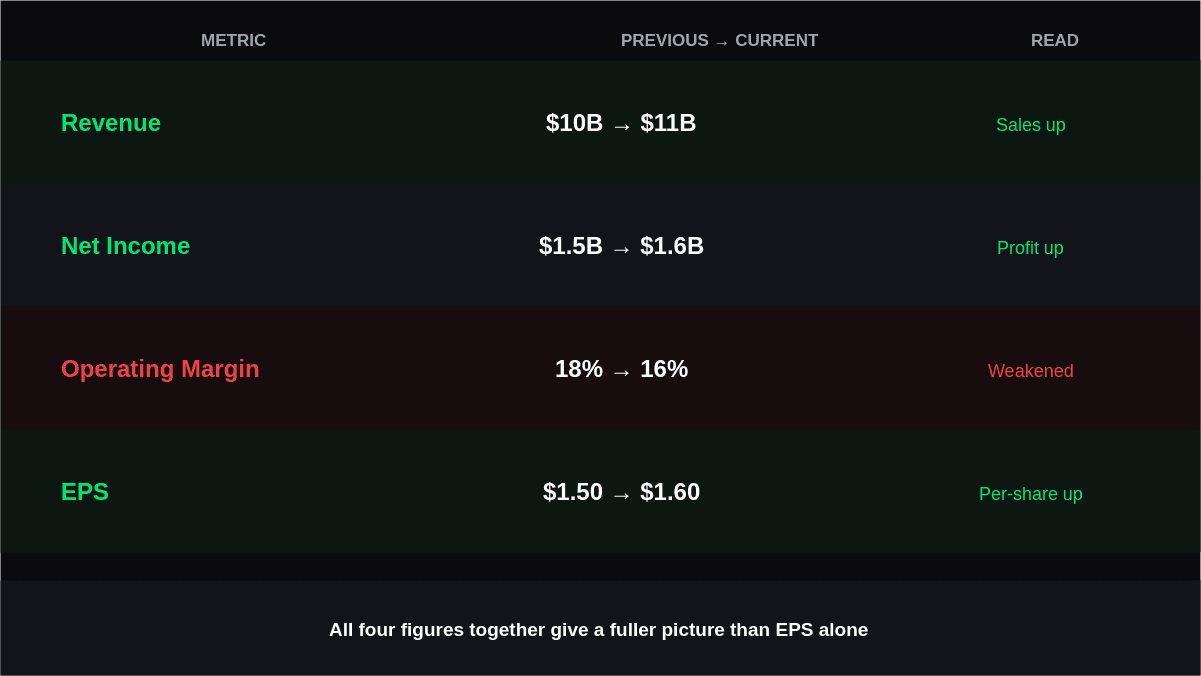
Consider this simplified example:
| Metric | Previous Period | Current Period | Possible Interpretation |
|---|---|---|---|
| Revenue | $10 billion | $11 billion | Sales increased |
| Net income | $1.5 billion | $1.6 billion | Profit increased |
| Operating margin | 18% | 16% | Profitability weakened |
| EPS | $1.50 | $1.60 | Per-share earnings increased |
Looking at all four figures gives a more complete picture than focusing only on the increase in EPS.
How Expectations Are Already Reflected in Stock Prices
Stock prices can move before an earnings announcement because investors continuously form expectations about future results.
Analyst estimates, company announcements, industry trends, economic conditions, and previous financial results can all influence those expectations. By the time the actual report arrives, some anticipated information may already be reflected in the stock's price.
This is why an earnings release does not automatically produce a positive reaction when results are strong. The market may have expected those results already.
The key question for investors is often not simply, "Were earnings good?" but rather, "How did the results compare with what the market expected?"
Why Earnings Day Can Create Large Price Swings
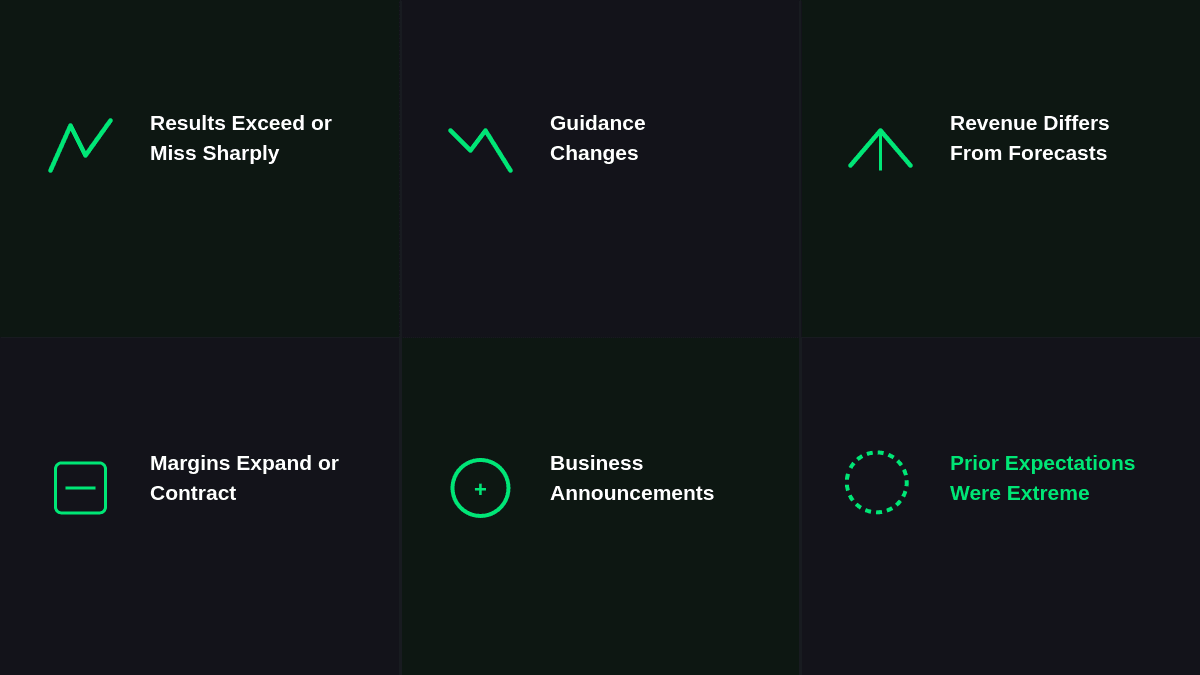
Earnings announcements can introduce new information into the market within a short period. When that information differs significantly from expectations, buyers and sellers may quickly adjust their valuations.
Price movement can become particularly noticeable when:
- Results significantly exceed or miss expectations.
- Management changes its future guidance.
- Revenue growth differs sharply from forecasts.
- Profit margins expand or contract unexpectedly.
- The company announces important business developments alongside its results.
- Investors had unusually high or low expectations before the announcement.
The size of the move depends on the information released, existing expectations, liquidity, market conditions, and how investors interpret the company's future prospects.
Conclusion
Understanding how earnings affect stock prices starts with recognizing that markets react to both financial results and expectations. Revenue, EPS, margins, cash flow, and guidance can all change how investors view a company's future.
A strong report can support the stock, but a disappointing outlook or results below expectations can produce the opposite reaction. Traders can also watch key levels as the stock responds to the earnings announcement.
For beginners, the most useful approach is to compare reported performance with expectations and examine what the results suggest about future growth. This provides more context than judging an earnings announcement simply as good or bad.