Financial Prediction involves estimating future market or financial outcomes from historical and current data. Machine learning methods can help identify relationships across large datasets, and Gradient Boosting in Finance is one approach used for building predictive models.
Instead of relying on a single decision tree, gradient boosting combines many sequential trees, with each new tree attempting to improve the weaknesses of the previous ones. This makes the method useful for structured financial datasets containing price, volume, fundamental, or economic variables.
This article explains how gradient boosting works for financial applications, where it can be useful, how to prepare data, and what limitations should be considered.
What Is Gradient Boosting?

Gradient boosting is an ensemble machine learning technique that builds multiple weak prediction models, usually decision trees, in sequence. Each new model focuses on reducing the errors made by the existing ensemble.
The process generally involves:
- Starting with an initial prediction.
- Measuring the prediction errors.
- Training another tree to address those errors.
- Combining the new tree with the existing model.
- Repeating the process until the desired number of iterations is reached.
Unlike bagging methods that typically train models independently, boosting creates a chain of models where later models depend on the information generated by earlier ones.
How Gradient Boosting Supports Financial Prediction

Financial datasets often contain numerous variables that may interact in nonlinear ways. Gradient boosting can capture these relationships without requiring every relationship to be manually specified.
For example, a model could use:
- Historical returns
- Trading volume
- Volatility measurements
- Moving-average features
- Valuation ratios
- Interest-rate data
- Economic indicators
- Company-specific financial metrics
The model can then estimate a defined target, such as the probability of a price increase, a future return category, or a credit-related outcome.
The quality of the prediction depends heavily on how the target is defined and whether the available features would actually have been known at the prediction time.
Building Financial Forecasting Models With Gradient Boosting
Developing a useful model requires more than selecting an algorithm. The entire research process should reflect how financial information becomes available over time.
1. Define the Prediction Target
First determine exactly what the model should predict. Possible targets include a future return over a specified period, a directional movement, volatility, or a classification outcome.
A clearly defined target prevents the model from being evaluated against an ambiguous objective.
2. Prepare Time-Ordered Data
Financial observations are sequential, so randomly mixing historical observations can create unrealistic training conditions. Features should be constructed using information available before the prediction point.
This helps reduce look-ahead bias and creates a more realistic testing environment.
3. Select Relevant Features
Feature selection should focus on variables with a defensible relationship to the target. Adding large numbers of weak or redundant variables can make the model more complicated without necessarily improving its ability to generalize.
4. Train and Validate
The dataset can be divided into chronological training, validation, and test periods. Hyperparameters should be selected using the earlier data rather than repeatedly optimizing against the final test period.
This process is particularly important for Machine Learning for Financial Prediction, where changing market conditions can make historical relationships unstable.
Important Parameters to Control

Gradient boosting models contain several parameters that influence their behavior.
| Parameter | What It Controls | Why It Matters in Finance |
|---|---|---|
| Number of estimators | Number of boosting rounds | Too many can increase overfitting |
| Learning rate | Contribution of each tree | Smaller values can require more trees |
| Maximum tree depth | Complexity of individual trees | Deep trees can capture noise |
| Subsampling | Portion of data used per iteration | Can add variation and reduce overfitting |
| Minimum samples per leaf | Minimum observations in a leaf | Helps control overly specific patterns |
There is no universally appropriate parameter combination. The correct settings depend on the dataset, prediction horizon, target, and validation methodology.
Evaluating Model Performance Beyond Accuracy
A model can appear successful during development while performing poorly on unseen financial data. Evaluation should therefore use metrics that match the prediction task and provide meaningful backtesting metrics.
For classification, researchers may examine precision, recall, F1 score, or ROC-AUC. For regression, metrics such as mean absolute error and root mean squared error may be appropriate.
For market-related applications, model predictions can also be examined alongside a carefully defined trading or decision-making simulation. However, such simulations should account for transaction costs, slippage, liquidity, and other implementation assumptions.
Gradient Boosting vs Traditional Financial Models
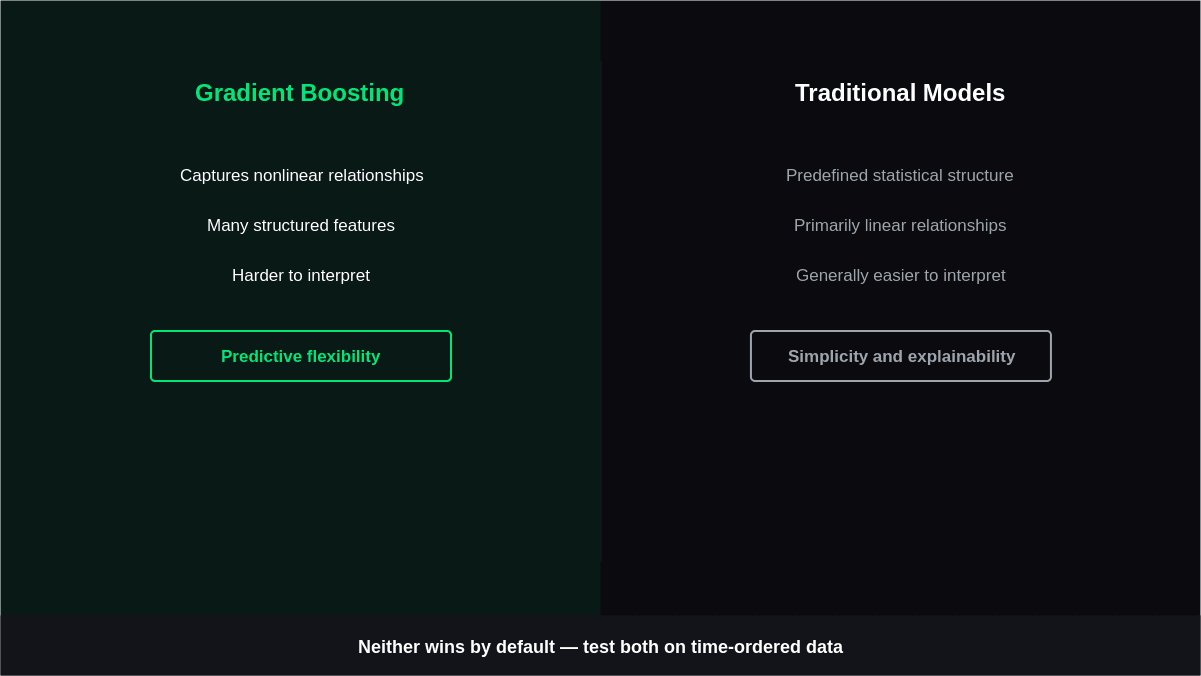
Traditional financial models and machine learning methods approach prediction differently. Statistical models such as linear regression are often easier to interpret, while gradient boosting can identify more complex nonlinear relationships within structured financial data.
The choice depends on the prediction objective, available data, interpretability needs, and how the model will be validated on unseen observations.
| Factor | Gradient Boosting | Traditional Financial Models |
|---|---|---|
| Model structure | Combines multiple decision trees sequentially | Often uses predefined statistical relationships |
| Relationship handling | Captures nonlinear interactions between variables | Linear models primarily capture linear relationships |
| Feature requirements | Can work with many structured features | Often requires stronger assumptions about relationships |
| Interpretability | More difficult to explain than simple statistical models | Generally easier to interpret |
| Overfitting risk | Can be high if model complexity is not controlled | Depends on model specification and number of variables |
| Data flexibility | Useful for complex datasets with interacting features | Works well when relationships can be reasonably specified |
| Validation needs | Requires careful tuning and out-of-sample testing | Still requires appropriate statistical validation |
| Typical consideration | Predictive flexibility | Simplicity and explainability |
Neither approach should be selected solely because it is more sophisticated. Comparing their performance on properly separated, time-ordered data can provide a more meaningful basis for determining which method fits a particular financial prediction task.
How to Make Financial Prediction More Reliable
A disciplined workflow can improve the credibility of results:
- Use chronological validation rather than inappropriate random splits.
- Define every feature based on information available at that point in time.
- Keep the final test period untouched during model development.
- Compare the model with simple baseline methods.
- Test performance across different market periods.
- Include realistic transaction costs when evaluating trading applications.
- Monitor whether predictive performance changes after deployment.
- Reassess features when their underlying economic relationships change.
These practices help distinguish a model that genuinely generalizes from one that simply explains historical data.
Common Risks When Using Gradient Boosting

Gradient boosting can be useful for analyzing complex financial datasets, but its flexibility also introduces several risks. Poor data preparation, excessive model complexity, and changing market conditions can affect the reliability of predictions. Identifying these issues early helps create a more disciplined modeling process.
- Overfitting historical patterns
- Allowing data leakage
- Ignoring changing market conditions
- Excessive feature engineering
Conclusion
Financial Prediction with gradient boosting can provide a flexible way to analyze relationships within structured financial data. Its sequential decision-tree approach can capture nonlinear patterns that simpler models may overlook, but flexibility also creates risks such as overfitting, leakage, and unstable relationships.
A sound process therefore requires careful feature construction, chronological validation, appropriate benchmarks, and realistic evaluation assumptions, with avoiding overfitting trading strategy being an important consideration.
The algorithm is only one part of the process; the quality and timing of the underlying financial data can be equally important.