A fair value gap (FVG) refers to a price imbalance that occurs in a situation when the market movement is sharp in one direction, leaving a region where trading activity has been low. It is normal practice for traders to pay attention to such regions since it is likely that the price will revert back to them before moving on.
Instead of making every single imbalance an automatic buy signal, traders can employ a systematic approach that will allow them to assess if there is sufficient evidence behind the trade setup. These steps include looking at the trend, spotting the gap, confirming it, and assessing risks.
In this blog you will find everything related to the fair value gap including how to spotit, confirm and trade FVGs.
What Is a Fair Value Gap?
The fair value gap is recognized through three consecutive candles. In the bullish case, the low of the third candle should remain above the high of the first candle, and in the bearish case, the high of the third candle should remain below the low of the first candle.
The gap is identified using the first, middle, and third candles.
Key points:
- Middle candle: Typically represents the greatest price extension and leads to imbalance.
- Bullish case: An upward trend leads to an area where there is very little or no overlap of the candles.
- Bearish case: A downtrend causes an identical gap in the reverse direction.
The concept focuses on how quickly price moved through an area, not on the assumption that price must return to fill the gap.
How Does a Fair Value Gap Form?
There are cases where the strong buying/selling pressure causes the price to move quickly through the levels. In some cases, there is aggressive movement that makes the consecutive candles limited overlap.
A simplified bullish sequence looks like this:
Candle 1 → Strong upward displacement → Candle 3
If Candle 3's low stays above Candle 1's high, the space between those two prices represents the gap.
A bearish formation works in the opposite direction:
Candle 1 → Strong downward displacement → Candle 3
Here, Candle 3's high remains below Candle 1's low.
The important point is that the gap develops because of rapid displacement, so traders should consider the strength and context of the move rather than looking for the pattern mechanically.
Bullish and Bearish Fair Value Gaps
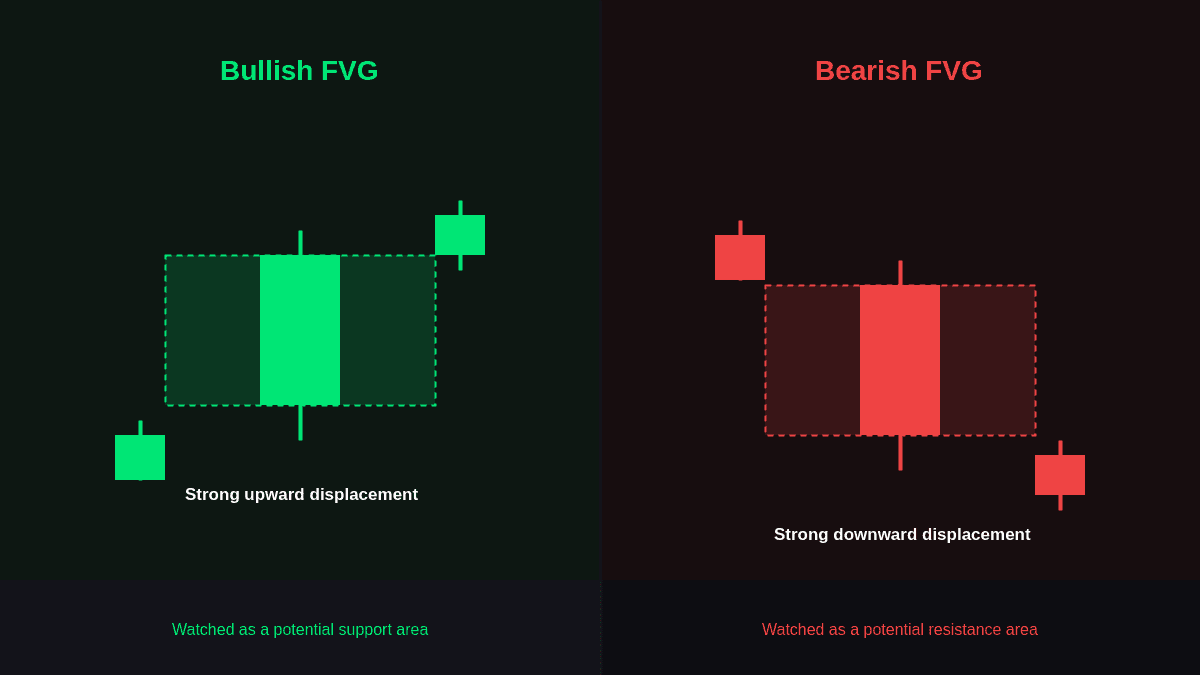
The direction of the fair value gap is an indication of the aggressiveness of the buyer and seller at the time when the price is moving. The bullish gap indicates that there is strong buying pressure, whereas the bearish gap shows there was strong selling pressure.
This distinction can help traders assess the broader price action before looking for potential setups.
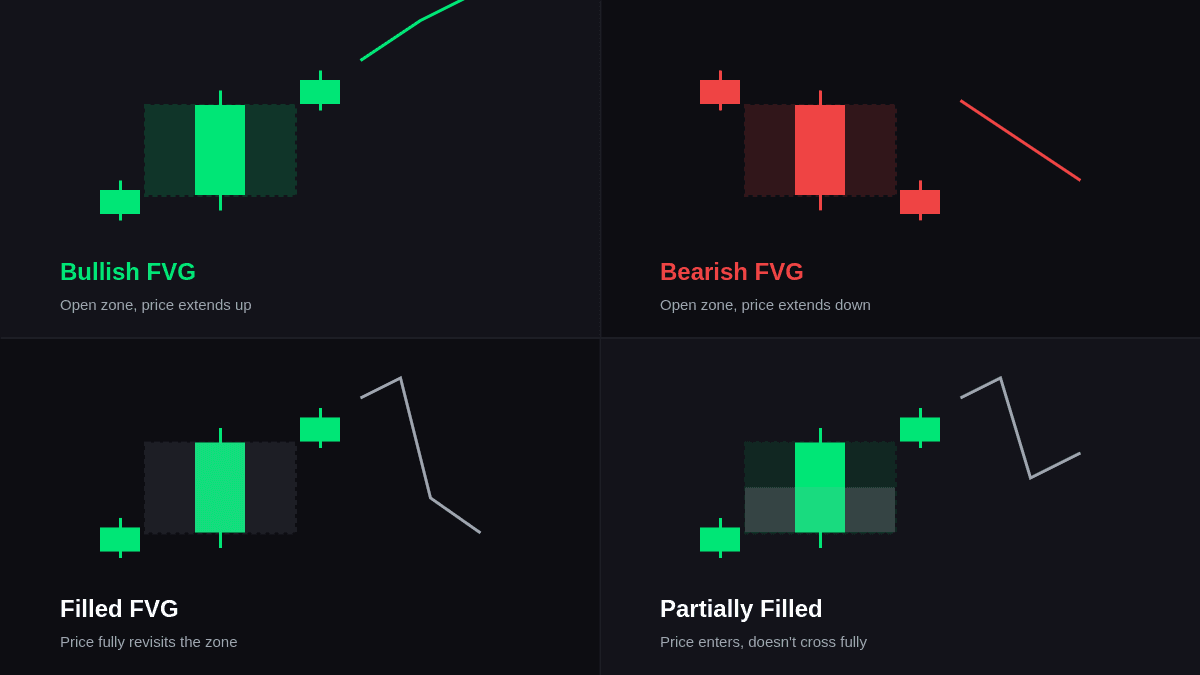
| Type | Formation | What It May Indicate | What Traders Watch |
|---|---|---|---|
| Bullish FVG | Third candle's low is above first candle's high | Strong upward displacement | Potential support area |
| Bearish FVG | Third candle's high is below first candle's low | Strong downward displacement | Potential resistance area |
| Filled FVG | Price returns through the imbalance | Previous inefficiency has been revisited | Reaction after the return |
| Partially filled | FVG Price enters but does not completely cross the zone | Some of the imbalance has been revisited | Whether price rejects or continues through |
These interpretations are not guaranteed. A bullish gap can fail to support price, while a bearish gap can be completely invalidated.
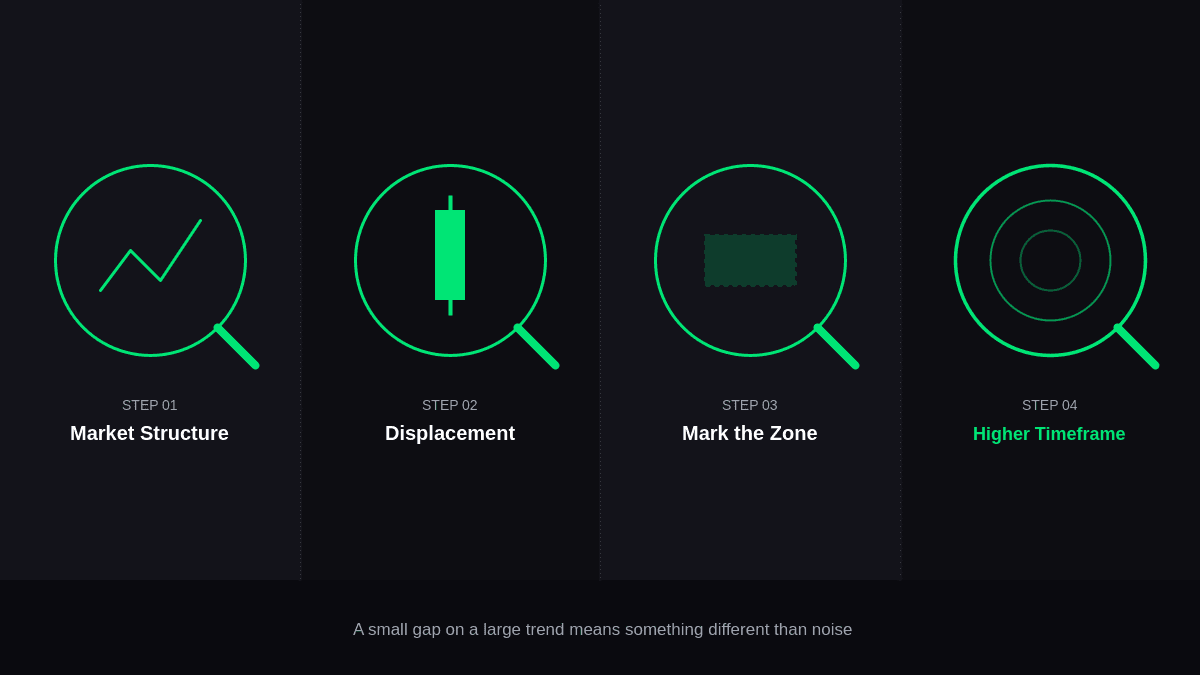
4 Step Guide: How to Identify a Fair Value Gap on a Chart
Finding these zones becomes easier when you use a consistent chart-reading process. Below you will find a step by step guide to follow:
Step 1: Start With the Market Structure
Before filling the individual gaps, it is important to understand the overall tendency of the market to be rising, falling, or ranging.
A bullish gap could carry more significance when there is already an existing rise in the market, and vice versa for a bearish gap.
Step 2: Look for Strong Displacement
All three candle formations do not necessarily have to be labeled. Find a significant expansion when price action is moving much faster than in previous candle formations.
A large bodied candle formation, momentum and breaking out of the recent trend pattern may be an indication that it is a significant movement.
Step 3: Mark the Imbalance
After the identification of the three candles pattern, a zone is formed between the first candle and the third candle.
This zone helps in observing price if it comes back to the zone.
Step 4: Check the Higher-Timeframe Context
In case a gap is formed on the smaller timeframe, this might not be very significant looking at the bigger picture.
It could be checked on the higher timeframes whether the trade is in tune with the general market trend or just noise.
How to Confirm a Fair Value Gap Before Entry
A fair value gap indicator may assist the trader in identifying possible imbalances, but an indicator is not a substitute for the analysis of the chart. It would be best to use the identified zone in conjunction with other supporting factors.
Let’s examine some of those factors:
- Market Structure: Try to find any kind of trend or structural change in favor of the expected movement.
- Displacement: A strong move into the zone makes the zone more interesting than a weak three-candle pattern.
- Liquidity Context: The reaction to any liquidity event will add an extra context.
- Price Reaction: See how candles react after entering the zone rather than entering directly into it.
- Alignment to Higher-Timeframes: Any setup in line with a higher-timeframe trend will have better directional bias.
Confirmation does not eliminate risk. It simply helps prevent traders from treating every visible gap as a trade opportunity.
5 Stages Guide: A Practical Fair Value Gap Trading Strategy
A fair value gap trading plan will enable traders to consider any trade setup without depending on the gap itself. The trader should incorporate the gap into the market structure, price action, and confirmation prior to making a trade decision.
The following five stages help in identifying and confirming a fair value gap setup.
1st Stage: Establish Direction
Start with recognizing the broader market bias. Is it more to the buyer’s favor or to the seller’s favor?
2nd Stage: Locate a Relevant Gap
Identify an imbalance that is bullish or bearish and consistent with the existing directionality. Refrain from highlighting all minor gaps on the chart.
3rd Stage: Wait for Price to Return
Instead of going after the first wave of displacement, wait for a retest of the price to come back into the area.
This does not necessarily mean that the formation is valid because the market might ignore this area altogether.
4th Stage: Look for Entry Confirmation
When price enters the area, you should see confirmation that the anticipated trend is getting stronger. It could be anything like a reversal candle, reduced structure, or a gain in momentum.
5th Stage: Define the Trade Before Entering
It’s important to identify entry point, invalidation level, and target point before initiating the trade to avoid any emotional changes in the trade setup.
Where Should You Place the Stop-Loss and Take-Profit?
Risk management should be based on the setup and not the other way round. Before getting into the trade, the trader should know the point at which the setup fails and where to take profit.
- Bullish set-up: The point of invalidation could be placed either below the corresponding structural level or below the corresponding fair value gap.
- Bearish set-up: The point of invalidation could be placed either above the corresponding structural level or fair value gap.
- Profit objective: The profit target could be set at swing levels, highs/low points, liquidity points, or risk to reward ratios.
- Position sizing: The amount of risk should also be taken into account in order not to damage your entire trading account with one wrong trade.
The key is consistency. A technically attractive setup can still produce poor results if the potential reward does not justify the amount being risked.
Fair Value Gap vs. Other Price-Action Concepts
The fair value gap is just one of many aspects of price action analysis and may be even more valuable when coupled with other market indications. Ideas like market structure, liquidity bands, and support and resistance can offer added perspective.
This comparison will help traders interpret the gap and not view it as an isolated trade indicator.
| Concept | Main Focus | How It Differs From an FVG |
|---|---|---|
| Fair Value Gap | Price imbalance created by rapid displacement | Identifies an area left behind during an aggressive move |
| Liquidity Sweep | Price taking nearby highs or lows before reversing or continuing | Focuses on the interaction with liquidity |
| Break of Structure | Change in an established swing relationship | Focuses on structural direction |
| Order Block | Price area associated with a significant move or institutional-order interpretation | Focuses on a potential supply or demand area |
| Support/Resistance | Historically important price levels | Uses repeated reactions rather than a three-candle imbalance |
These concepts can overlap, but they should not be treated as interchangeable patterns.
How to Improve Your FVG Analysis
Quality matters more than the number of zones on a chart. A cleaner approach is to filter potential setups using a small set of consistent criteria.
Ask yourself:
1: Is the market direction clear?
2: Was the gap created by meaningful displacement?
3: Does the zone fit the higher-timeframe context?
4: What happened when the price returned to the area?
5: Where is the setup invalidated?
6: Does the potential reward justify the risk?
Keeping these questions consistent can make your analysis more objective and reduce impulsive entries.
Common Mistakes When Trading FVGs
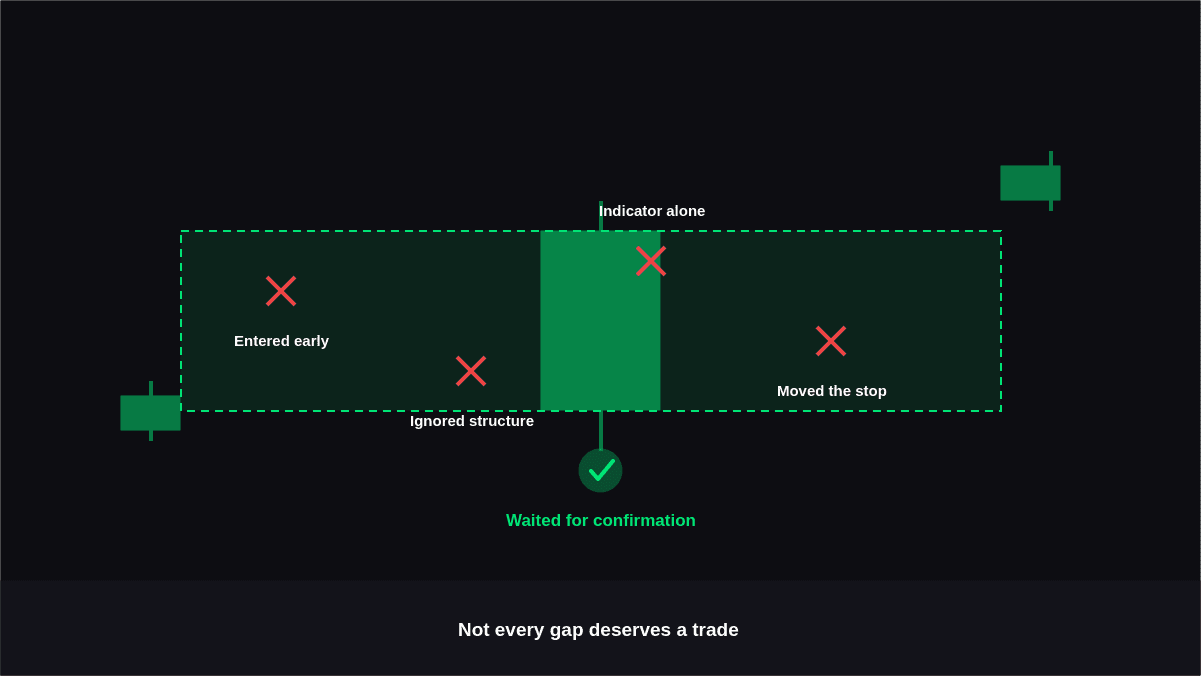
The most common mistake is making an assumption that all gaps will reverse or close. The market may perform well without addressing the imbalance, and a return to the area may bring about a full breakout of the zone.
Other mistakes include:
- Enter before the price gets to its target level
- Forget about the structure of the overall market
- Think that the signal given by the indicator is enough for confirmation
- Draw too many gaps that have no importance
- Adjust your stop-loss after you enter the trade
- Trade without figuring out your risks and rewards
- Believe that a gap implies buying or selling by institutions
The goal is not to predict every movement. It is to identify situations where the available evidence creates a clearly defined trading opportunity.
Final Thoughts
The fair value gap provides an interesting approach for traders to analyze imbalances formed in price action amid fast market movement. However, the pattern itself should not be considered an independent buy/sell signal but should be seen as a combination of the zone with market structure, momentum, confirmation, and risk management.
The best way to proceed is to approach any setup through the hypothesis that needs to be tested. You need to mark the imbalance, find out the reason for its formation, wait until price confirms it, and define the risks. Through analysis and testing, you will be able to find out whether setups based on the FVG work for you or not.
Frequently Asked Questions
1. What is a fair value gap in trading?
The fair value gap is created when there is a considerable directional move that leads to insufficient overlaps of three successive candles. This area is watched by traders for any possible reaction of prices.
2. Does every fair value gap get filled?
No. Some gaps will be revisited, but some will never be revisited, as the price keeps moving in its original direction. The gap should be viewed, therefore, as a zone of interest and not necessarily a price target.
3. Is a fair value gap a buy or sell signal?
Not necessarily. A bullish gap can support a bullish trade, just as a bearish gap supports a bearish trade. But investors need to take other factors into account before executing trades.
4. What timeframe is best for finding FVGs?
There is no perfect timeframe that works for everybody. Higher timeframes will give you the bigger picture of the market, but smaller timeframes can reveal better entry points for your trades.
5. Can beginners use fair value gaps for trading?
Yes, but one must first understand how the pattern is formed and be able to identify it without the immediate risk of losing any money at all.