Divergence indicator is used by traders as a tool which helps them to evaluate the relation between price and momentum in order to discover scenarios where the market is becoming weaker. Unlike trend following, divergence trading uses both price action and momentum to see the contradiction between them.
It can serve as a good alert system indicating that a particular move is fading out. However, divergence is not a surefire reversal pattern and its effectiveness increases when it is combined with other factors.
In this blog you will learn every important pointer related to the divergence indicator.
What Is a Divergence Indicator?
A divergence indicator is a technical analysis indicator that emphasizes the difference between price movement and the momentum of the underlying security.
For instance, if a security is forming a new high but the RSI is forming a lower high at the same time, the price continues to move upwards, but the momentum does not follow. The discrepancy could indicate weakening buying momentum.
The same concept can be observed when the market moves downwards. For instance, when a lower low is formed by the price, but a higher low is formed by an oscillator, the selling momentum becomes weaker.
The key factor is the fact that the divergence indicator is all about momentum and price movement correlation, not about direction only.
How Divergence Works on a Trading Chart
Divergence is identified by comparing corresponding swing points on two sections of a chart:
- Price structure: Look at consecutive highs or lows.
- Momentum structure: Examine the corresponding highs or lows on an oscillator.
- Compare the direction: Determine whether price and the indicator are moving in opposite directions.
- Wait for confirmation: Look for additional evidence before entering a trade.
Some common oscillDivergence Indicator: How to Spot Trend Reversals Fastators used for this include RSI, MACD, and the Stochastic Oscillator. Since each oscillator measures momentum in a different way, it may indicate divergence at different points.
The best strategy would be not to use divergence as a signal for buying or selling, but as an indication that something is changing.
Bullish and Bearish Divergence
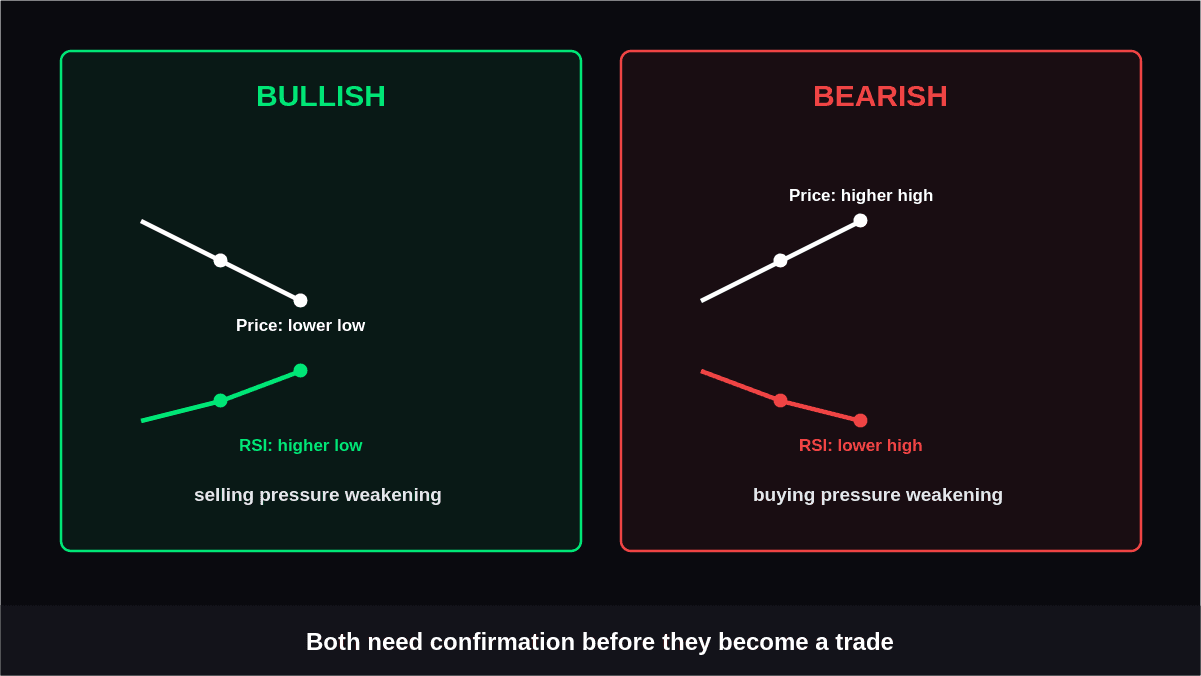
Bullish and bearish divergence represents two different types of disagreement between price and momentum. The comparison between price swings and swings of indicators can help traders identify any changes in market momentum.
Bullish Divergence and What It Can Signal
A bullish divergence typically occurs when the price makes a lower low but the momentum indicator forms a higher low.
In this case, it shows that the sellers drove the price below a certain level, but there was not much momentum in the down move. Sometimes this reduction in momentum marks the beginning of a turnaround.
For example:
- Price makes a lower low.
- RSI makes a higher low.
- Selling pressure appears to be weakening.
- Price later breaks a nearby resistance or swing high.
Final confirmation is important because a bullish divergence may persist even as prices continue to fall. The trader should look at the general market structure rather than assuming that the pattern is a good long trade.
Bearish Divergence and Weakening Buying Pressure
Bearish divergence happens when the price hits a higher high level, whereas the momentum indicator registers a lower high level.
This means that buyers are still driving the price to go up, but the momentum is getting weaker.
A potential setup might look like this:
- Price creates a new swing high.
- The oscillator produces a lower high.
- Price approaches a resistance zone.
- A bearish reversal pattern or structural break appears.
As these factors begin to come into agreement with one another, the divergence becomes much more significant. The price will keep rising without confirmation, nonetheless.
Regular vs. Hidden Divergence
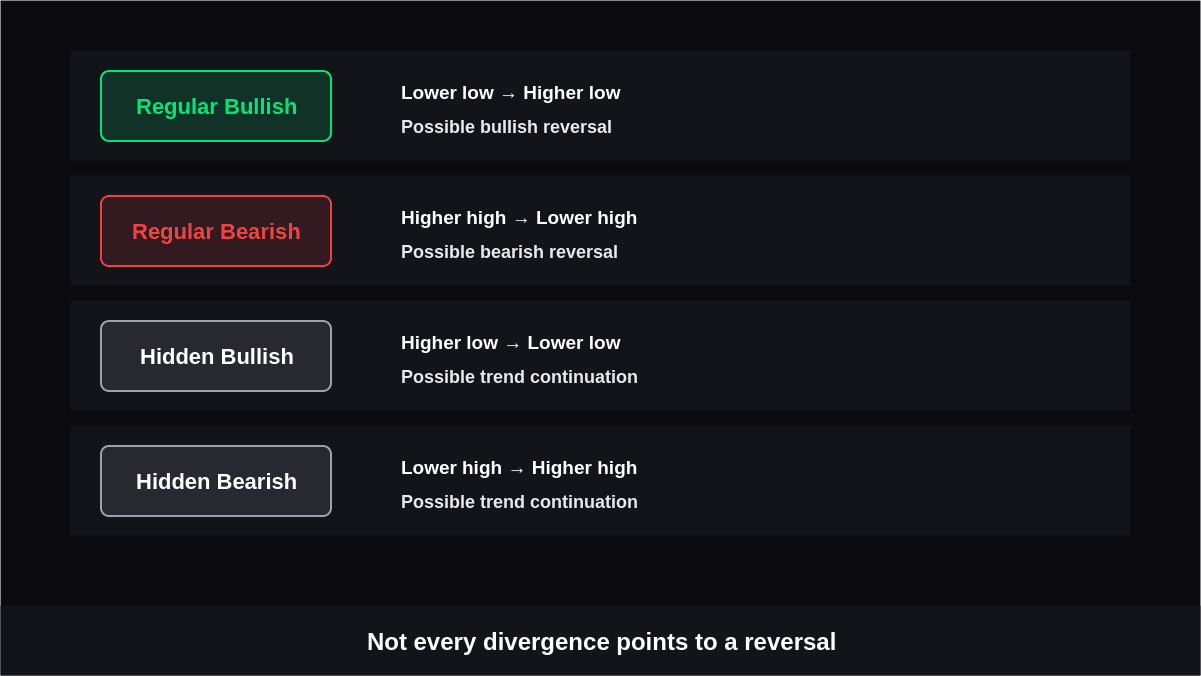
Both divergence types appear identical in chart patterns but have different functions when applied to trading analysis. The knowledge of their difference will help a trader to decide on whether there is a possible reversal or continuation pattern.
| Type | Price Action | Indicator Action | Common Interpretation |
|---|---|---|---|
| Regular bullish | Lower low | Higher low | Possible bullish reversal |
| Regular bearish | Higher high | Lower high | Possible bearish reversal |
| Hidden bullish | Higher low | Lower low | Possible trend continuation |
| Hidden bearish | Lower high | Higher high | Possible trend continuation |
Regular divergence usually indicates possible shifts from the current trend. Hidden divergence is frequently employed to detect continuity setups amid the ongoing trend.
Such difference allows for avoiding the situation when all divergences are treated as reversal signals by traders.
Which Indicators Can Detect Divergence?
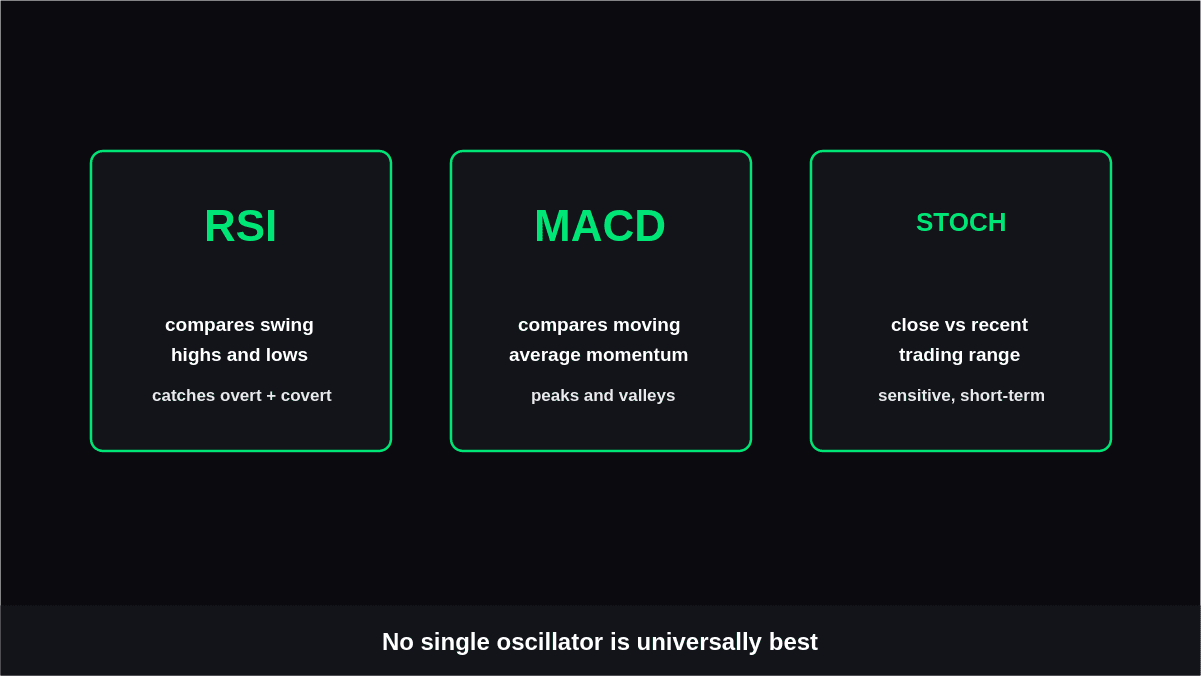
Different momentum indicators can be used to find divergence, but three are particularly common.
RSI
The RSI has found popularity in trading due to the ease with which swings can be compared with high and low prices. The RSI can assist in finding both overt and covert divergence.
MACD
The MACD formula evaluates momentum through comparisons of moving averages. Divergence can be determined by comparing fluctuations in price to MACD peaks and valleys.
Stochastic Oscillator
The Stochastic Oscillator calculates the ratio of an asset’s closing price to its recent range of trading prices. The high sensitivity of this indicator makes the formation of divergence possible in short-term periods.
The best choice depends on the market, timeframe, and trading method rather than on one universally superior indicator.
How to Build a Divergence Trading Strategy
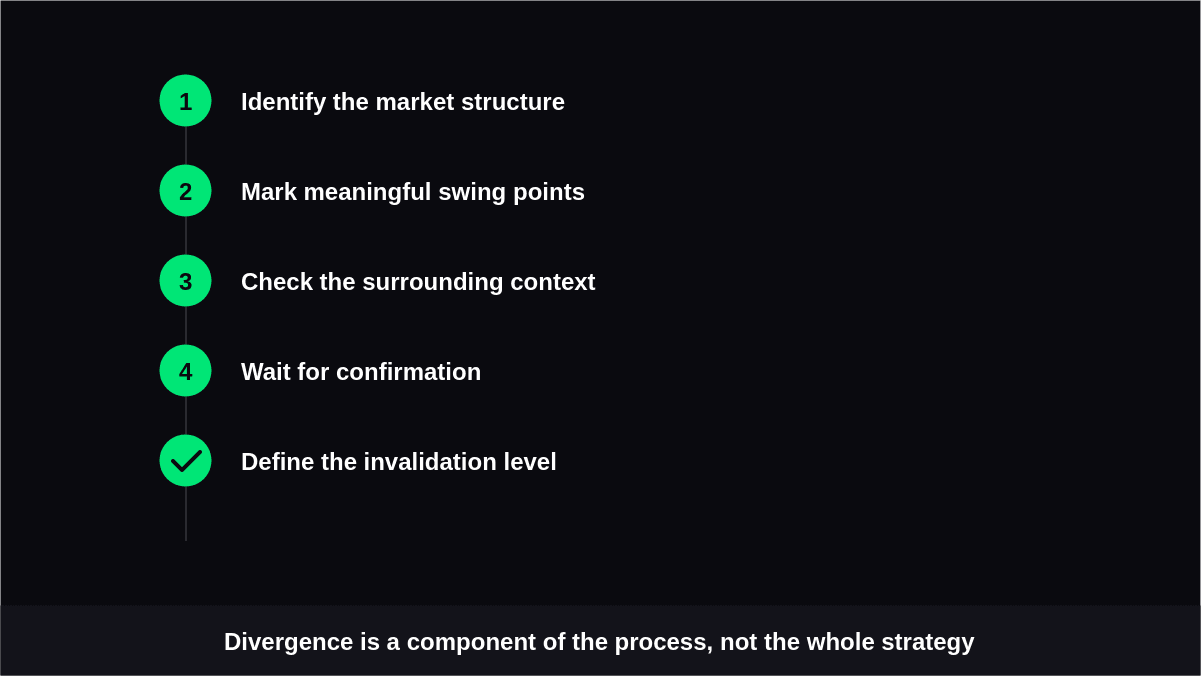
A successful divergence trading strategy needs to incorporate the concept of divergence within a much wider decision-making framework.
- Identify the market structure: Determine whether the market is trending upward, trending downward, or moving sideways before looking for a setup.
- Mark meaningful swing points: Compare clear highs and lows rather than random or minor candles.
- Check the surrounding context: Look for support, resistance, trendlines, or other technical factors near the divergence.
- Wait for confirmation: A break of a recent swing point, rejection candle, market structure shift, or renewed momentum can strengthen the setup.
- Define the invalidation level: Establish the price level that would prove the trade idea wrong before entering the position.
The systematic process can prevent impulsive trades and ensure that deviation is a component of a systematic trading process.
How to Improve Divergence Signal Quality
Improving divergence analysis can be done by improving the context surrounding the signal and not merely through additional indicators. The following factors can help traders evaluate whether a setup has meaningful technical support.
| Factor | What to Look For | Why It Matters |
|---|---|---|
| Significant swing points | Compare clear and meaningful highs or lows rather than minor price fluctuations. | Reduces the chance of interpreting insignificant price movements as divergence. |
| Key market levels | Look for divergence around major support and resistance zones. | These areas can provide additional context for a potential market reaction. |
| Multiple timeframes | Use a higher timeframe for broader structure and a lower timeframe for confirmation. | Helps align the divergence with the larger market direction. |
| Historical testing | Test the indicator, timeframe, entry trigger, and exit rules using historical data. | Shows whether the setup has performed consistently under different market conditions. |
Utilizing these factors will assist traders in screening out poor divergence setups and concentrating on setups with better technical significance.
This is because the main goal is not about generating signals, but rather identifying divergences that provide useful insights into making a trade decision.
Common Mistakes When Using Divergence
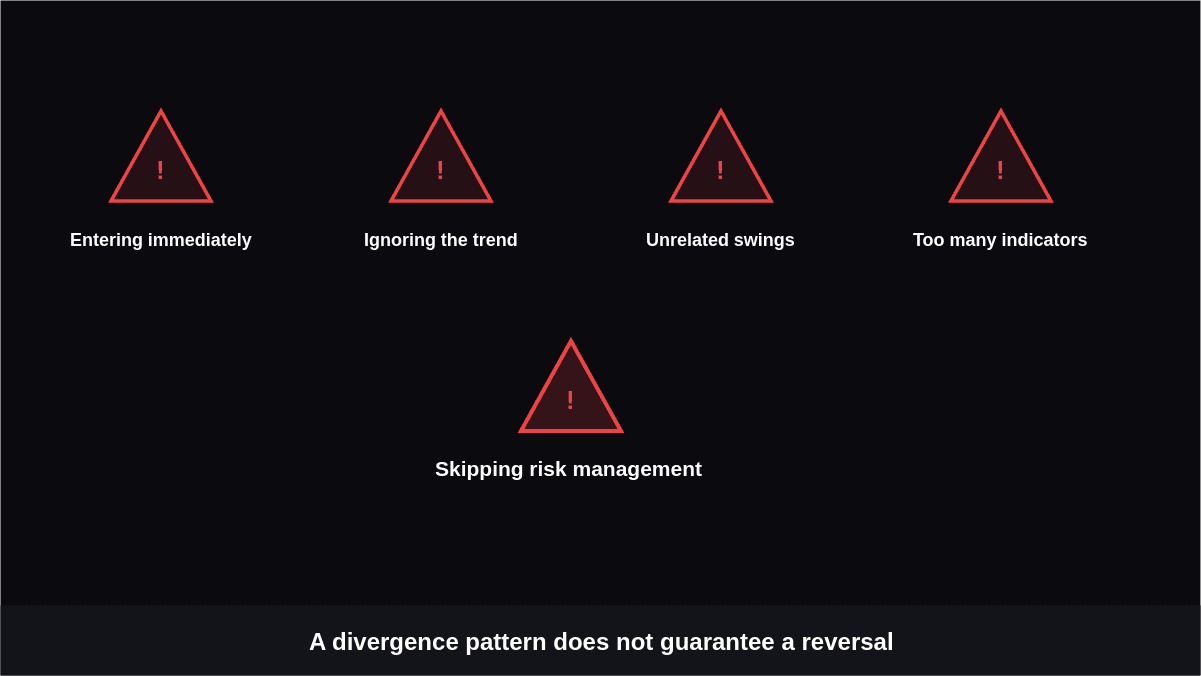
Divergence can be useful, but several mistakes can reduce its effectiveness:
- Entering immediately: A divergence pattern does not guarantee that price will reverse.
- Ignoring the trend: Strong trends can continue despite repeated divergence.
- Comparing unrelated swings: The price and indicator points should correspond to meaningful market pivots.
- Using too many indicators: Adding multiple oscillators can create unnecessary conflicting signals.
- Skipping risk management: Even a well-formed setup can fail unexpectedly.
Conclusion
A divergence indicator can help traders in identifying the moment when the momentum starts diverging from the price direction. In the bullish case, it can serve as a warning about the weakening of the sell pressure, and in the bearish case, it might indicate the weakening of the buying pressure.
The best results will be achieved if the trader applies divergence in combination with the comprehensive analysis, and not as an automatic signal for entering the trade.
It means that in case of proper application, along with the swing points, the market structure, and the risk management techniques, the divergence will be more selective.