Price and momentum don't always agree. When they don't, that disagreement has a name: divergence. Divergence in trading happens when the price of an asset moves in one direction while a momentum indicator, like RSI or MACD, moves in the opposite direction. That mismatch is one of the earliest warnings that a trend is losing strength, before most traders notice anything on the raw price chart.
This guide breaks down exactly what divergence is, the difference between regular and hidden divergence, which indicators reveal it best, and how to trade it without falling for the false signals that trip up most beginners.
What Is Divergence in Trading?
Divergence is a disagreement between two things you're measuring on the same chart: price and a derivative of price, usually a momentum oscillator. Price shows you what is happening. Momentum shows you how much force is behind it. When both are aligned, a trend is healthy. When they split apart, the trend is running out of fuel.
Think of it like a car losing speed while it's still moving forward. The car (price) hasn't stopped yet, but the engine (momentum) is already backing off. Divergence is the technical analysis equivalent of that: a leading signal that shows up in the "engine" before it shows up in the "speedometer."
Because of this, divergence is classified as a leading indicator, unlike moving averages or trendlines, which only confirm a move after it's already underway.
The Two Types of Divergence
Traders usually mean one of two distinct patterns when they say "divergence." Confusing the two is the single most common mistake in this part of technical analysis
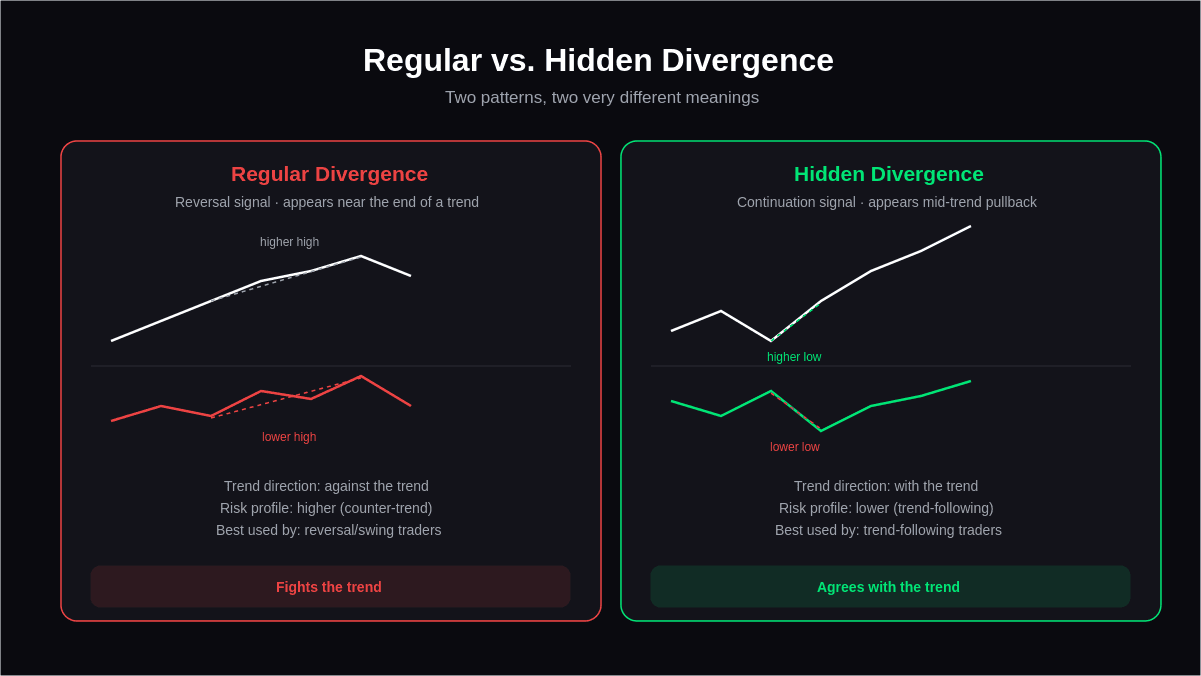
| Type | What it Signals | When it Appears |
|---|---|---|
| Regular Divergence | Trend reversal | Near the end of an existing trend |
| Hidden Divergence | Trend continuation | During a pullback or consolidation inside a trend |
Regular Divergence (Reversal Signal)
Regular divergence warns that the current trend is losing momentum and may reverse.
- Bullish Regular Divergence: Price makes a lower low, but the oscillator makes a higher low. This suggests selling pressure is fading and buyers may be stepping back in.
- Bearish Regular Divergence: Price makes a higher high, but the oscillator makes a lower high. This suggests buying pressure is fading near the top of a move.
Hidden Divergence (Continuation Signal)
Hidden divergence is the opposite use case: it confirms that a pullback is temporary and the dominant trend is likely to resume.
- Bullish Hidden Divergence: Price makes a higher low, but the oscillator makes a lower low, inside an uptrend.
- Bearish Hidden Divergence: Price makes a lower high, but the oscillator makes a higher high, inside a downtrend.
Quick memory rule: Regular divergence fights the trend (reversal). Hidden divergence agrees with the trend (continuation).
Which Indicators Show Divergence Best?
Divergence can technically be measured against any oscillator, but three tools dominate real-world use because they're built specifically to track momentum rather than raw price.
| Indicator | Best for | Divergence Behavior |
|---|---|---|
| RSI (Relative Strength Index) | Overbought/oversold extremes | Compares recent gains vs. losses; clean signals in ranging markets |
| MACD | Trend + momentum combined | Divergence shows in the histogram and the MACD/signal line crossover |
| Stochastic Oscillator | Short-term momentum shifts | Fast-reacting; useful for scalping and lower timeframes |
| On-Balance Volume (OBV) | Volume-confirmed divergence | Flags when price moves without real participation behind it |
RSI and MACD remain the two most widely used tools because they balance sensitivity with reliability across most market conditions, including trending, ranging, and volatile alike.
How to Spot Divergence on a Chart (Step by Step)
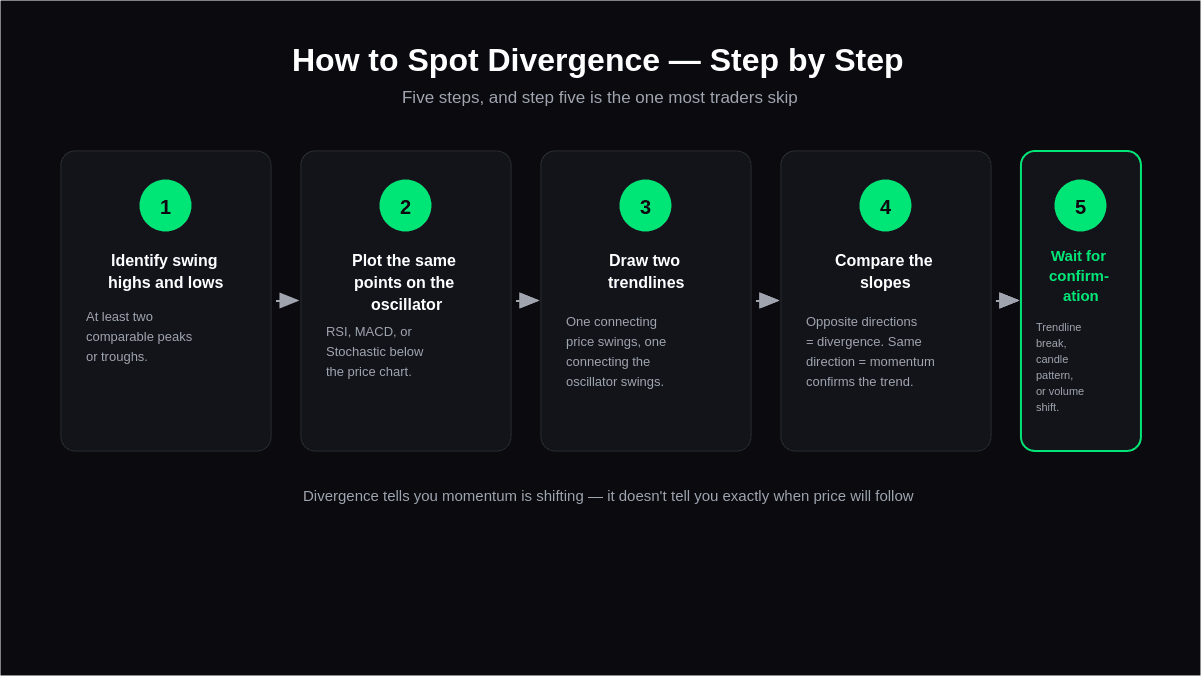
Identify swing highs and lows on the price chart. You need at least two comparable peaks or troughs to compare against the indicator.
Plot the same swing points on your oscillator (RSI, MACD, or Stochastic) directly beneath the price chart.
Draw a trendline connecting the price swings, then draw a second trendline connecting the matching indicator swings.
Compare the slope of both lines. If they point in opposite directions, you have divergence. If they match, momentum confirms the trend.
Wait for confirmation, such as a break of a trendline, a candlestick reversal pattern, or a shift in volume, before acting on the divergence alone.
Skipping step five is where most retail traders get burned. Divergence tells you momentum is shifting; it doesn't tell you exactly when price will follow.
Why Divergence Alone Isn't Enough
Divergence is a probability tool, not a certainty. A stock or crypto asset can show bearish divergence and continue climbing for weeks before price finally turns. This is especially common in strong trending markets, where momentum can stay "divergent" far longer than most traders can stay patient.
That's why divergence works best as a confirmation layer stacked with other tools rather than a standalone entry signal:
- Support and resistance: divergence near a key level carries far more weight than divergence in open space.
- Volume analysis: rising price on falling volume alongside bearish divergence strengthens the reversal case.
- Multi-timeframe alignment: a bearish divergence on the 4-hour chart matters more when the daily chart also shows exhaustion.
This is exactly the gap that automated systems were built to close. Instead of manually cross-checking oscillators, price structure, and volume by eye, algorithmic trading indicators can scan multiple confirmation layers simultaneously and flag only the setups where they line up, reducing the guesswork that causes traders to act on divergence too early.
Regular Divergence vs. Hidden Divergence: Side-by-Side
| Factor | Regular Divergence | Hidden Divergence |
|---|---|---|
| Market condition | End of a trend | Mid-trend pullback |
| Trade direction | Against the current trend | With the current trend |
| Risk profile | Higher (counter-trend) | Lower (trend-following) |
| Best used by | Reversal/swing traders | Trend-following traders |
Common Mistakes Traders Make With Divergence
- Trading every divergence signal. Not all divergence leads to a reversal or continuation, so treat it as a warning, not a trigger.
- Ignoring the broader trend. Hidden divergence in a downtrend is bearish, not bullish, since the direction of the primary trend changes the entire read.
- Using only one timeframe. A divergence on a 5-minute chart carries far less weight than the same pattern on a 4-hour or daily chart.
- Skipping risk management. Even a textbook divergence setup can fail; a stop-loss beyond the recent swing point is non-negotiable.
- Confusing divergence with a crossover. A MACD crossover and MACD divergence are two different signals that are frequently mixed up by newer traders.
This is also where a lot of retail traders quietly rediscover an older lesson: distribution and divergence often show up together. The topping structure described in Wyckoff distribution frequently overlaps with bearish divergence on RSI or MACD, since both concepts are trying to describe the same thing: momentum drying up before smart money exits.
Divergence and Automated Signal Tools
Spotting divergence by eye across dozens of charts, timeframes, and assets isn't realistic for most traders juggling a full-time job. This is where algorithmic systems add real value: rather than replacing technical analysis, they process it faster and more consistently.
GainzAlgo's engine, for example, cross-references momentum shifts with price structure and volume in real time, then delivers the output as clean real-time trading signals directly on your TradingView chart, with no manual line-drawing between price and oscillator swings required. For traders who already understand divergence conceptually but want fewer false positives, pairing manual chart reading with an automated confirmation layer, like the presets inside GainzAlgo V2, often closes the gap between spotting a pattern and trusting it enough to act.
The same logic applies to equities. If you're trading stocks specifically, the exhaustion signals described here work alongside the setups covered in our guide to the best trading indicator for stocks, since divergence tends to behave differently on large-cap, liquid names than it does on thinly traded small caps.
Key Takeaways
- Divergence in trading is a mismatch between price direction and momentum direction.
- Regular divergence signals a possible reversal; hidden divergence signals a possible continuation.
- RSI, MACD, Stochastic, and OBV are the most common tools for spotting it.
- Divergence is a leading signal, not a guarantee, so always wait for structural confirmation.
- It performs best combined with support/resistance, volume, and multi-timeframe analysis, and works well alongside automated signal tools that check these layers simultaneously.
Frequently Asked Questions
What is divergence in trading?
Divergence in trading is when the price of an asset and a momentum indicator, such as RSI or MACD, move in opposite directions, signaling that the current trend may be weakening.
What's the difference between regular and hidden divergence?
Regular divergence signals a potential trend reversal and appears at the end of a trend. Hidden divergence signals a potential trend continuation and appears during a pullback within an existing trend.
Which indicator is best for spotting divergence?
RSI and MACD are the two most widely used indicators for spotting divergence, since both are built to measure momentum rather than raw price movement. Stochastic Oscillator and OBV are commonly used as secondary confirmation.
Is divergence a reliable trading signal on its own?
No. Divergence should be treated as an early warning rather than a standalone entry trigger. It works best when confirmed with support/resistance levels, volume, candlestick patterns, or multi-timeframe analysis.
Can divergence fail?
Yes. Price can continue moving in its original direction for an extended period even after divergence appears, particularly in strong trending markets. This is why stop-loss placement and confirmation signals matter.
What timeframe works best for trading divergence?
Higher timeframes (1-hour and above) generally produce more reliable divergence signals than very short timeframes, since there's less noise distorting the pattern.