Directional dependence tests are quantitative techniques used to evaluate if the direction of one variable holds any information about the future direction of another variable. Directional relationships can provide insights into whether a given directional pattern is persistent, random, or could be of use in developing a trading strategy.
Performance of a trading strategy can result from any of a number of things, such as a temporary relationship in the market, favorable environment, or just luck. Analyzing directional relationships becomes another tool to test beyond analyzing the returns , and it pairs naturally with the kind ofbacktesting traders already rely on to build trust in a signal.
Directional dependence testing should primarily be viewed as a research tool for investigating whether a relationship has statistical and potentially economic significance, rather than as a standalone trading signal.
What Is Directional Dependence Testing?
Directional dependence tests investigate the presence of a link between the motion of one variable and the future motion or direction of another variable.
For instance, a researcher may want to know if:
- A positive return in one market tends to precede a positive return in another.
- A specific price movement increases the probability of a particular future direction.
- A trading signal is followed by consistent directional outcomes, the same question traders ask when theyset up TradingView alerts to react as soon as the market shifts.
- The relationship remains present across different market regimes.
In such tests, the interest lies in identifying if there is a movement in the same or different direction.
This is important as the two variables might be relatively linearly uncorrelated but possess interesting directional properties. Directional dependence therefore provides a different perspective from traditional correlation analysis.
Why Directional Dependence Matters in Trading
There is plenty of noise in the financial markets. While something seems to be evident in a chart, once the analysis is performed on a larger sample, there will not be any more of it.
Analysis of directional dependence may assist in determining what is an actual pattern and what is worthy of further research.
For instance, if a certain trading strategy provides a signal for a long position whenever a certain market condition is present, a traders could study how probable it is that the market moves up under that condition.
The result can provide information such as:
- Frequency of positive outcomes
- Frequency of negative outcomes
- Conditional probability of a direction
- Stability across different periods
- Differences between market regimes
- Potential changes in the relationship over time
However, even with statistical dependence, it doesn’t necessarily mean that there is a profitable trade available. The statistical dependence may exist, but the relationship may not be strong enough to offset transaction costs, slippage, etc.
The practical question is therefore not only whether dependence exists, but whether the relationship is large, stable, and robust enough to have potential economic value.
Directional Dependence Testing vs. Correlation
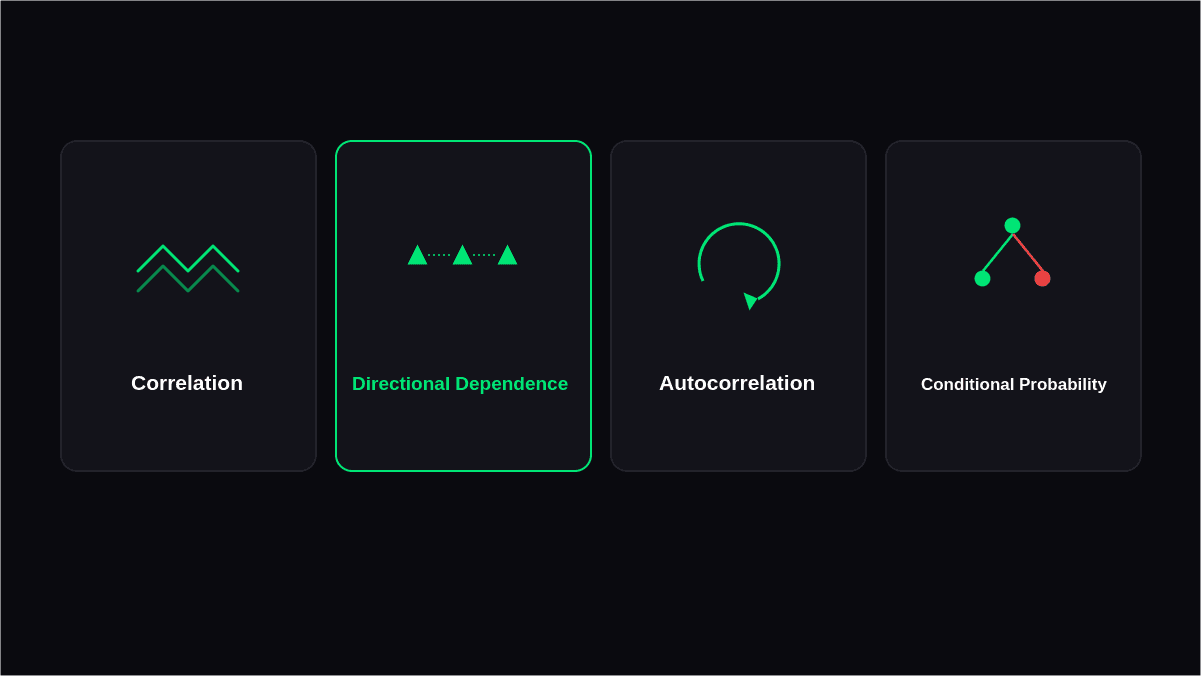
Correlation refers to the extent to which two variables are related in accordance with a specific statistical association. Directional dependency, on the other hand, considers a new angle, in that it focuses on the direction of movements.
Suppose you have two assets which show a weak association between their returns in terms of Pearson correlation. Though the movement of their returns may not be consistent, their movements may be directionally related.
This explains why directional analysis can work well with correlation analysis.
| Measure | Primary focus | Useful question |
|---|---|---|
| Correlation | Relationship between returns | Do the variables move together? |
| Directional dependence | Relationship between directions | Does one direction provide information about another? |
| Autocorrelation | Relationship with previous values | Does the past help explain future observations? |
| Conditional probability | Outcome given a condition | How often does a particular outcome follow a signal? |
Using several measures together can provide a more complete view of a strategy's behavior.
How Directional Dependence Testing Works
A basic approach begins by converting observations into directional categories.
For example:
- Positive return = Up
- Negative return = Down
- Zero return = Neutral
The direction of one observation can be compared to the direction of another observation in the next period.
For example, assume that there are 10,000 daily observations. Rather than analyze only the actual return figures, the researcher may analyze whether an observation of "Up" is often followed by another "Up".
Such an analysis could be conducted for various other situations and time periods.
For example:
Signal → next-day direction
Signal → five-day direction
Market A direction → Market B direction
Previous trend → subsequent direction
The important point is that the testing framework must be defined before interpreting the results. Repeatedly changing the variables, thresholds, time periods, or testing rules after examining the data creates a significant risk of data mining and data snooping.
Key Tests and Methods
A number of statistical techniques may be applied, depending upon the nature of the question and the characteristics of the data.
Contingency Tables
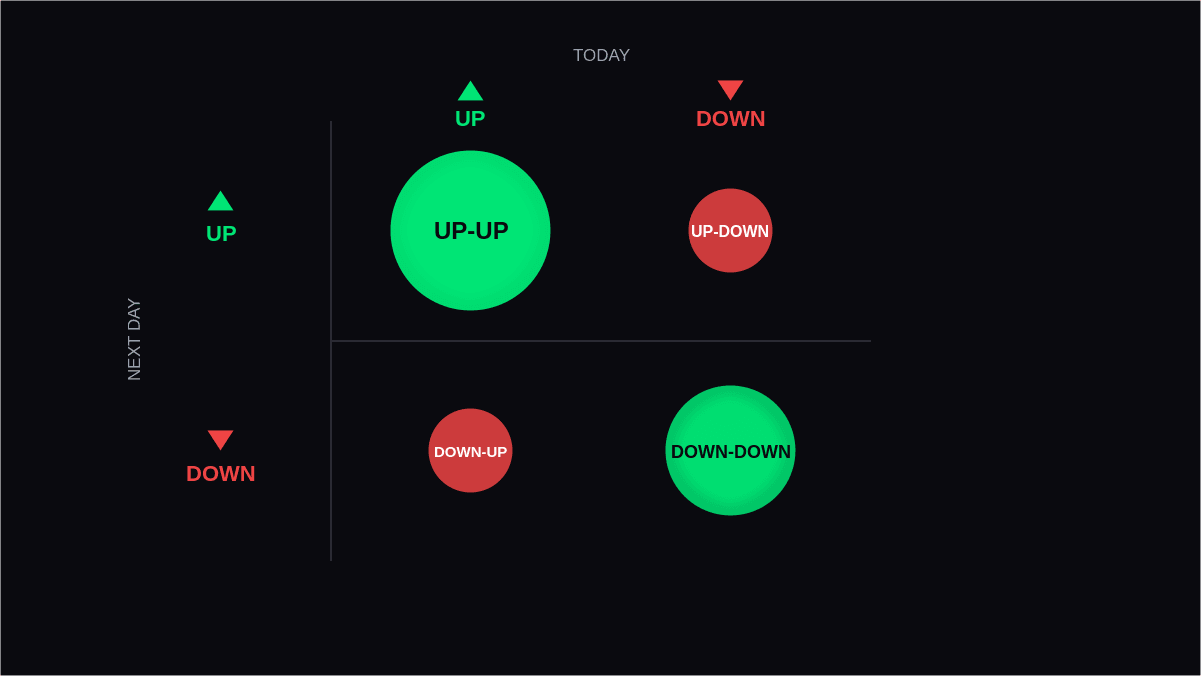
Contingency tables make it possible to classify observations according to combinations such as Up-Up, Up-Down, Down-Up, and Down-Down.
This technique provides a convenient way of testing for an excess number of directional combinations.
Chi-Square Testing
The chi-square test statistic may be used to test for the independence of the categorical variables.
A significant chi-square outcome indicates that there exists some connection between the directional classes. On the other hand, an insignificant outcome suggests that there is not enough information to reject the assumption of independence. It does not mean that the two variables are independent.
Another consideration is to examine the expected number of cases since very small values may reduce the validity of the usual chi-square approximation.
However, a significant outcome does not guarantee an economically meaningful relationship.
Conditional Probability
Conditional probability refers to the probability of the occurrence of a certain result based on an event.
For instance:
Probability of increase in returns given that the prior return was positive.
Conditional probability may prove to be useful while studying persistence and finding out whether any particular condition changes the distribution of future events.
Mutual Information
Mutual information could expose relationships that would otherwise go unnoticed using correlation.
This makes mutual information a possible tool for exploring more complicated relationships among variables. However, there is also need for caution when interpreting mutual information since advanced statistical methods will most likely find patterns that do not generalize.
Applying Directional Dependence Testing to Strategy Validation
Directional testing may serve as one aspect of overall quantitative strategy validation.
Such an approach could involve starting out by specifying a proper hypothesis.
Namely:
When situation X arises, there will be an increased chance of generating a positive return during the following trading interval.
Afterwards comes the identification of variables, observation intervals, time horizons, and statistics tests prior to checking out the final outcomes.
Traders have to split up all the available data into suitable intervals. If there is a robust correlation found in the sample of the hypothesis development, then it needs to be tested on different data sets.
The analysis should also consider:
- Transaction costs
- Slippage
- Position sizing
- Market regime changes
- Sample size
- Multiple testing
- Look-ahead bias
- Survivorship bias
- Out-of-sample performance
A statistically interesting relationship that disappears after realistic costs or out-of-sample testing may have little practical value.
A Practical Validation Workflow
There is a need for a systematic and well-defined process to enhance the reliability of directional research.
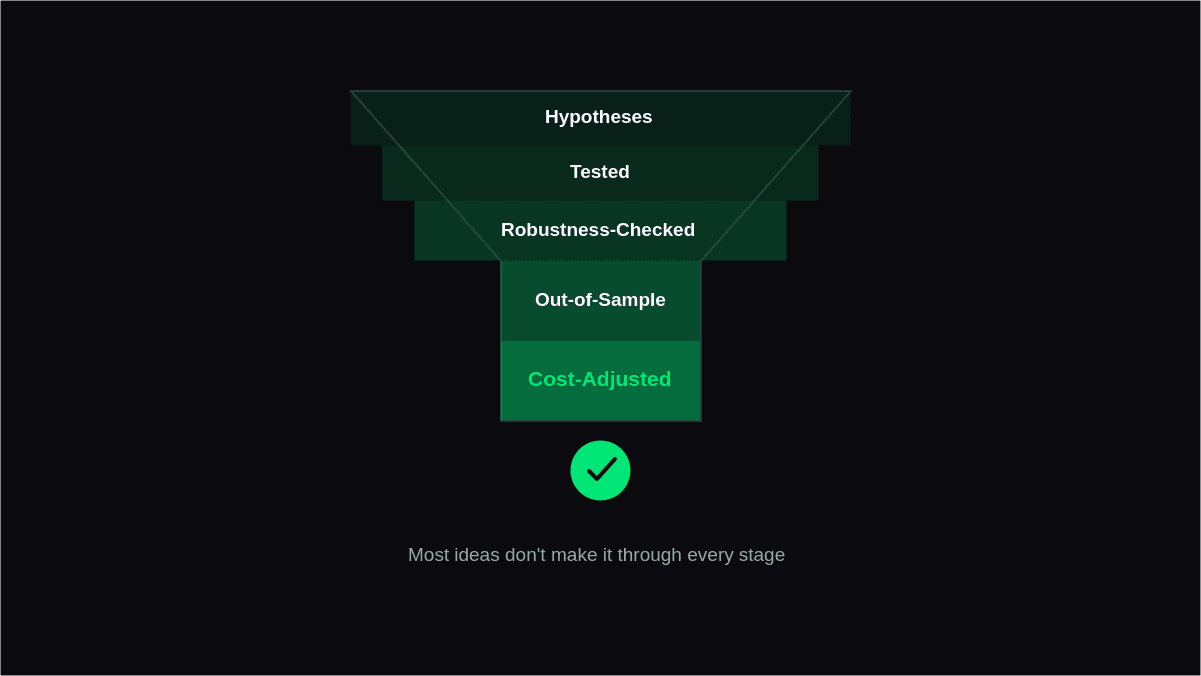
Below you will find a step by step guide to follow:
Step 1: Define the Hypothesis
Define explicitly the directional relationship to be tested.
Step 2: Prepare the Data
Clean historical data and make sure that the data points are all properly aligned.
Step 3: Define Direction
Have a clear criterion for categorizing the outcomes as either Up, Down, or Neutral.
Step 4: Select the Test
Choose a statistical method that matches the research question and data structure.
Step 5: Test Development Data
Use the initial dataset to determine whether the proposed directional relationship exists.
Step 6: Check Robustness
Test the relationship across different time periods, conditions, and market environments using time-series dependence testing.
Step 7: Perform Out-of-Sample Testing
Use data that was not involved in developing the hypothesis to determine whether the relationship persists.
Step 8: Include Trading Costs
Account for transaction costs, slippage, and other practical factors that can affect results.
Step 9: Monitor Over Time
Keep testing the relationship in order to see if it stays constant even in light of changes in the markets.
The decision should not be made based on only one statistic. A good relationship should stay consistent, pass the relevant tests, and have practical importance.
Directional Dependence vs. Normal Randomness
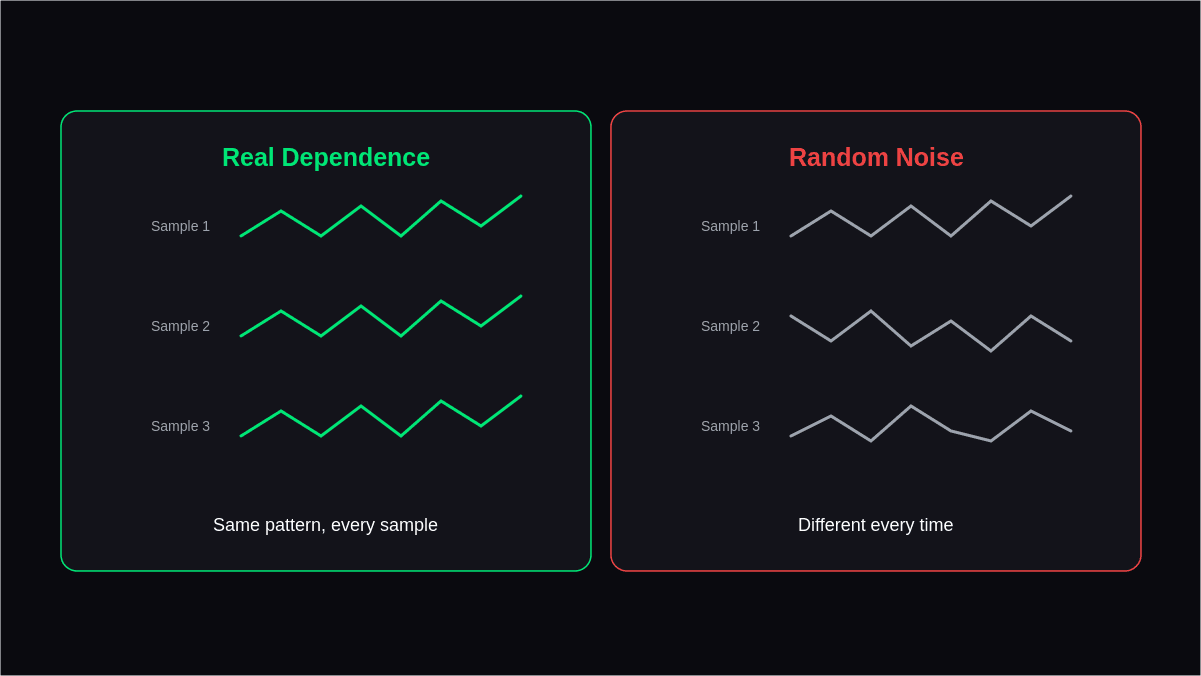
A directional pattern does not automatically indicate a meaningful trading relationship. The table below highlights the key differences researchers should consider.
| Factor | Directional Dependence | Normal Randomness |
|---|---|---|
| Observed pattern | A directional relationship is consistently present | A pattern is present at times accidentally |
| Relationship | Knowledge from one direction can help predict another outcome | Little knowledge can be predicted from previous direction |
| Statistical testing | The findings would vary from the assumption of independence | The findings are consistent with the assumption of the null hypothesis |
| Consistency | There may be consistency between the relationship across samples | The pattern may disappear with change in the sample size |
| Market conditions | It could be observable in the market conditions selected | There is no consistency across the market conditions |
| Repeated testing | Would be consistent after the appropriate testing | Apparent significance would disappear after further testing |
| Out-of-sample results | It would persist in out-of-sample testing | The pattern disappears in out-of-sample results |
| Interpretation | Possibility of dependence between the variables | Possibility of randomness between the variables |
| Research methodology | Necessitates the testing for consistency | Necessitates extreme caution before reaching conclusions |
Common Mistakes When Testing Directional Dependence
Directional testing can provide useful insights when the research process is carefully designed.
Avoiding common errors helps ensure that the results are interpreted accurately and not overstated.
- Treating statistical significance as profitability
- Testing too many hypotheses
- Ignoring market regimes
- Using future information
- Ignoring economic significance
- Relying on only one statistical measure
- Skipping out-of-sample testing
- Overlooking transaction costs
Conclusion
Directional dependence is a useful technique which makes it possible to investigate the existence of directionality of a certain market variable, signal, or event concerning some future directional movement. This technique may help to introduce an extra aspect into traditional research based on returns and may assist in the investigation of the problems of persistence, conditionality, and dependence.
Evidence of directional dependence alone should not be interpreted as evidence of a tradable advantage. In order to perform successful research, one should use the appropriate statistical test, perform out-of-sample analysis, consider trading costs, and avoid data mining.
A systematic trader's best approach to the problem would consist of combining directional analysis with other techniques of validation, such as correlation analysis, risk measures, robustness, and forward testing.
FAQs
1. What is directional dependence testing?
Directional dependence tests try to find out if there is a statistical relationship between the direction of one variable or event and the direction of another variable after that. In the context of trading studies, this test can aid in the determination of whether any pattern that can be seen is significantly different from that which would arise by chance alone.
2. How is directional dependence different from correlation?
While correlation is usually about how values are correlated in number, directional dependence is about how their directions are correlated. The two variables may be weakly correlated but show some degree of directional dependence.
3. Can directional dependence prove that a trading strategy is profitable?
Absolutely not. A significant relationship from a statistical point of view does not automatically imply that there will be a profitable strategy. In addition to all the statistical tests, researchers have to take into account transaction costs, slippage, risk, implementation, sample size, and out-of-sample performance.
4. Which statistical tests can be used for directional dependence?
Depending on the type of research, various measures of dependence are employed by analysts including contingency tables, chi-squared tests, conditional probabilities, mutual information, and so forth