Today traders employ technical indicators as a way to structure available market data and build consistent strategies based on them. However, technical indicators can also cause various problems, and common indicator mistakes may lead to poor trading decisions or weaken an otherwise sound strategy. The matter is that usually the problem is not in the indicator itself but in the approach of traders to work with them.
Any indicator, be it moving average, RSI, MACD, or whatever indicator that signals about volatility, will do good in its particular situation. However, no matter how effective the indicator used, it will never replace the inability of a trader to manage risks or to have an optimal trading environment or strategy.
This guide will show how you can avoid the most common mistakes while working with indicators and build a more consistent strategy without additional effort.
09 Most Common Indicator Mistakes Traders Make
The following are the most common indicator mistakes that are made by traders and knowing about these errors is the key to making the analysis more reliable.
1. Using Multiple Trading Indicators at Once
The use of additional indicators will create an illusion of getting additional confirmation for your trading setup. However, the fact is that the usage of numerous indicators can simply reflect various facets of price behavior rather than giving you the right result.
For example, a trader might use different momentum indicators that respond to changes in prices. The coincidence of indicators does not mean their independent confirmation.
How to Avoid?
A more sensible way would be to assign a certain role for each indicator.
One would be used to determine the trend direction, while another to measure momentum and a third to provide information on volatility. In the case when two indicators have the same role, there would be no need to use both.
The aim is not to generate the most signals but to make use of the most relevant information.
2. Treating Indicators as Predictive Signals
Indicators are mathematical calculations based on market data. They could assist in explaining what has happened or what is happening but they cannot predict what will happen.
For example, a bullish crossover does not necessarily mean that prices will keep going up. A market can reverse right after the signal or even stay range-bound despite having a great setup. Using reliablenon-repainting buy sell signals can help maintain chart consistency without historical distortion, but market context remains essential.
How to Avoid?
This is one of the most critical technical analysis mistakes because it causes traders to mistake probabilities for certainties.
Rather than asking, “Is this a good predictor for the next move?” ask questions like:
- Under what market circumstances does this signal work?
- When does the setup fail?
- What is the size of the risk?
- Does the price behavior confirm the signal?
- What occurs when the signal fails?.
3. Ignoring Market Context
The behavior of an indicator depends greatly on the conditions in which it is used.
The trend-following indicator will work effectively in times when there is a directional movement in the market but will give many false signals in case of a sideways market.
This is why the readings of an indicator need to be analyzed within the overall market situation.
How to Avoid?
Consider:
- Trend: Is there a directional movement in the market?
- Volatility:Is the volatility higher than normal?
- Liquidity: Is the market liquid enough for the strategy to be used?
- Timeframe:Does the signal coincide with the time horizon?
- Price structure: Are there key levels of support or resistance?
The context does not remove the element of risk, but it keeps us from interpreting signals identically under different market conditions.
4. Constantly Changing Indicator Settings
The vast majority of technical indicators have parameters that can be adjusted by traders. It may cause problems because traders can adjust their parameters too many times to make historical performance appear more attractive.
For instance, a trader can test different periods of the moving average and choose the best-performing period for the particular time frame in history. Such an approach may be quite misleading.
How to Avoid?
This tendency is very much like an indicator confirmation bias. Having chosen a specific outcome, one could inadvertently pay more attention to certain parameters or signals confirming one’s beliefs.
The best approach would be to determine the acceptable ranges for parameter values beforehand and to test the strategy in various market environments.
5. Optimizing Indicators Until the Backtest Looks Perfect
Backtesting can be helpful but repetitive testing may make back-testing become a form of optimization rather than validation.
Suppose a trader changes:
- Indicator type
- Indicator period
- Entry threshold
- Exit threshold
- Stop-loss level
- Take-profit level
- Trading timeframe
In this way, if such modifications are tested again and again on the same historical sample, the historical sample tends to shape the strategy.
How to Avoid?
This is when backtesting overfitting becomes an issue. A strategy might seem very effective based on past performance relative to arbitrarytrading strategy benchmarks, but is not very robust in the face of new information.
To reduce this risk, use a structured testing process:
- Establish the strategy logic before extensive testing.
- Separate development data from evaluation data.
- Limit unnecessary parameter changes.
- Test across multiple market environments.
- Validate promising results on unseen observations.
- Use walk-forward testing when appropriate.
The idea is not to achieve the optimal historical fit. The goal is to see if the logic behind it has any hope of making it through new information.
6. Ignoring Risk Management Because the Signal Looks Strong
Even the best indicator signals do not give any idea about the amount of capital that should be risked.
The trader can be right on the trend of the market but lose heavily due to an excessive position size or inappropriate placement of the stop loss.
Hence, indicator analysis needs to be kept apart from the risk considerations.
How to Avoid?
Before entering a position, establish:
- Maximum acceptable loss
- Position size
- Stop-loss or invalidation level
- Potential exit conditions
- Risk-to-reward considerations
This stops a strong looking signal from being used as an excuse for not adhering to disciplined risk management techniques.
7. Evaluating Indicators on Only One Market or Timeframe
A tool that proves effective for one asset or time frame might perform differently in another context.
For instance, a system created for an actively traded large-cap instrument will probably prove ineffective when applied to a less liquid asset. In addition, a signal designed for hourly charts will probably prove difficult to use in daily or five-minute charts.
How to Avoid?
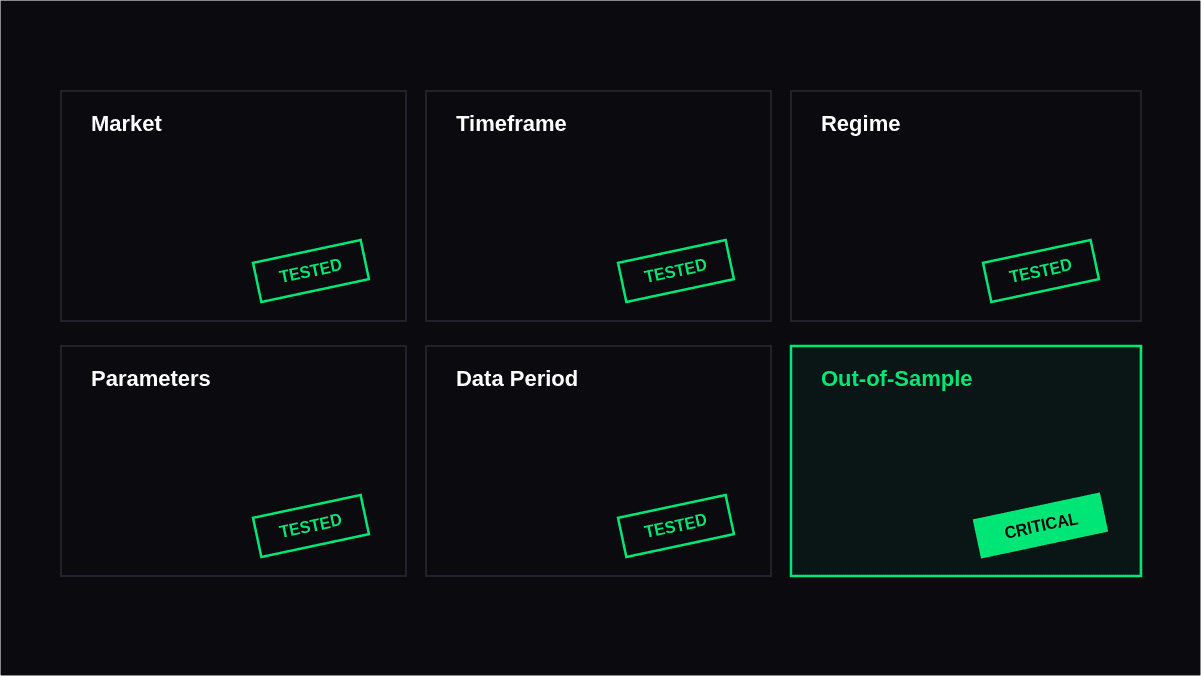
Testing in various conditions can indicate how stable or dependent the performance is in relation to specific historical circumstances.
| Test Area | What to Check | Why It Matters |
|---|---|---|
| Market | Different assets or instruments | Identifies asset-specific dependence |
| Timeframe | Shorter and longer periods | Tests whether the logic is timeframe-sensitive |
| Market regime | Trending, ranging, volatile, calm | Reveals where signals become weaker |
| Parameters | Nearby reasonable settings | Shows whether results are fragile |
| Data period | Different historical samples | Reduces dependence on one period |
| Out-of-sample data | Unseen observations | Provides a more realistic validation check |
While a good plan may not always require consistent performance everywhere, highly dependent performance in only one particular condition may need further consideration.
8. Using Indicators Without a Defined Trading Rule
An indicator can be hard to value when its interpretation varies from transaction to transaction.
For instance, a trader could trade based on RSI being low on one occasion, then look out for a price crossover on another, and go long based on momentum on the next. While each trade may be profitable, it still remains difficult to come up with an effective evaluation of such an approach.
How to Avoid?
Trading rules need to state what counts as an entry, what breaks the setup, how to handle exits, and how risks are managed.
Having clear rules also simplifies analysis because traders will be able to tell the difference between the performance of the trading system and the decision-making in execution.
9. Confusing More Signals With Better Validation
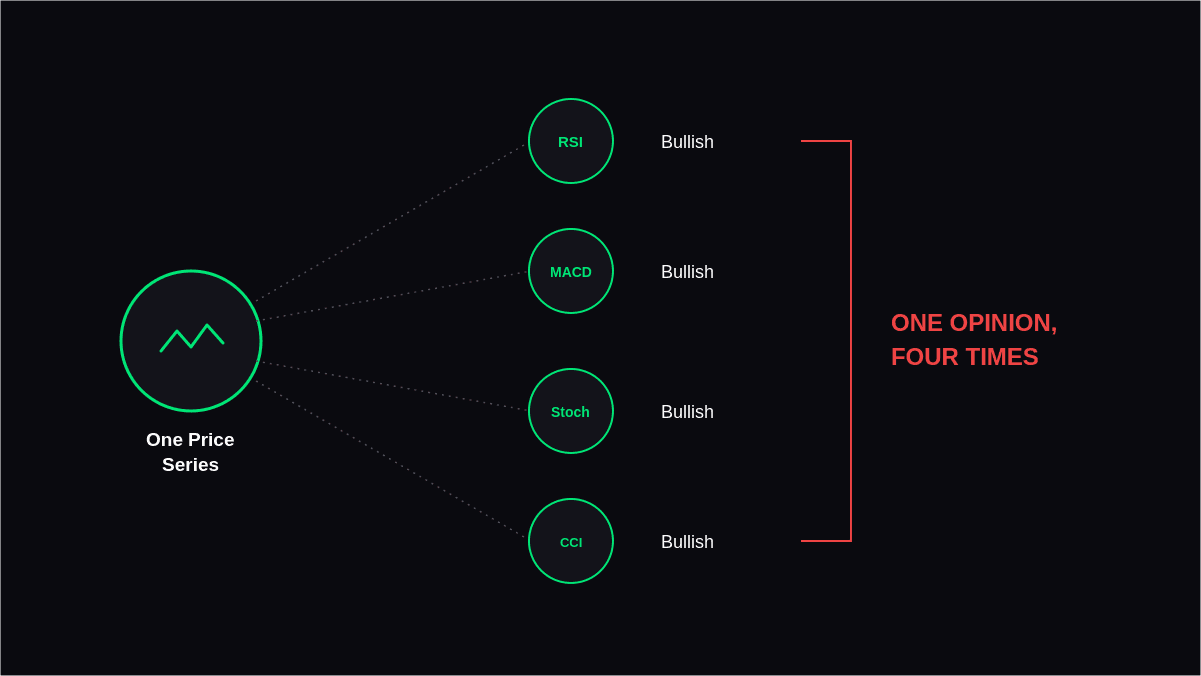
It is a fallacy to believe that agreement between several indicators necessarily makes a good case for a particular trade.
If four indicators happen to be bullish, it does not mean that there are four separate confirmations, as they might have been influenced by the same price trend.
How to Avoid?
Validation should thus center on both data that refute the strategy, as well as data that support the strategy.
Questions to consider include the following:
- Does the strategy continue to work when parameters are changed in a sensible manner?
- Does it work on data not used in the sample for development?
- Does it continue to work during poor market conditions?
- How sensitive is it to transaction costs?
- How often does the strategy suffer losing periods?
A strategy that withstands tests to prove its lack of value is often more revealing than a strategy that just comes up with a pretty historical chart.
How to Use Indicators More Effectively
Avoiding common indicator mistakes does not mean discarding technical indicators. It means applying them within a wider and testable context. Integrating a streamlined system like thebest lifetime access trading indicator allows you to focus on clear execution rather than juggling redundant tools.
A practical process is:
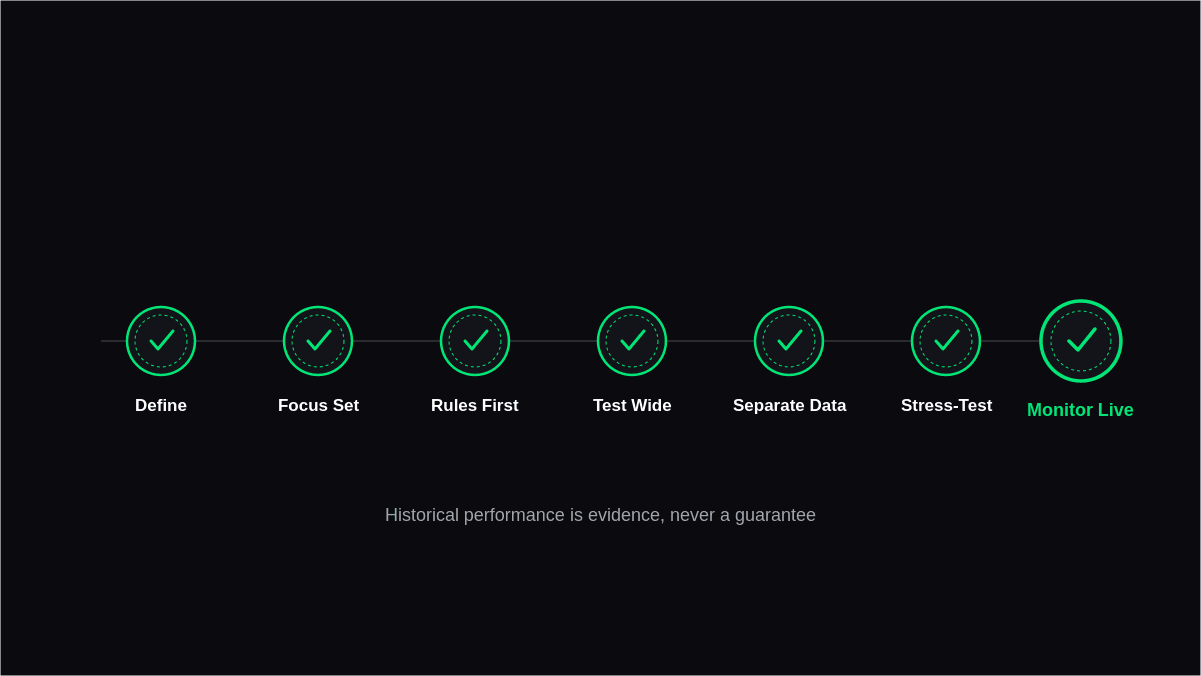
1. Define the objective: Determine the use of the indicator: for trends, momentum, volatility, timing, or some other purpose.
2. Keep the indicator set focused: Delete indicators that provide redundant information without adding value to the decision-making process.
3. Establish rules before testing: Make sure you have clear guidelines for entry, exit, risk management, and invalidation.
4. Test across different environments:Cover different conditions in terms of volatility, trends, and behavior of the markets.
5. Separate development from validation:Do not try to constantly optimize your trading system on the data, which is used to validate it.
6. Stress-test the assumptions: Check how the indicator performs when changing some of the parameters, costs, timing, etc.
7. Monitor live or unseen performance: The historical performance is an evidence, but not a guarantee for future success.
This approach implies incorporating indicators into your rigorous research framework instead of making them the cornerstone of your prediction-based system.
Final Thoughts
Avoiding common indicator mistakes in choosing indicators is not about choosing an ideal combination of technical tools. Rather, it is about making sure you understand how these tools fit into the larger picture of trading.
The most significant gains could be made by using fewer indicators with clear intentions, taking into account the market situation, keeping the risk level under control, and testing your strategy on data it has not been designed for. The traders also need to watch out for very good historical performance due to repeated optimization of their indicators.
An effective system does not test whether the indicator can give a perfect signal or not. Instead, it tests if the whole process of making decisions is sensible under changing conditions.
FAQs
1. What are the most common indicator mistakes?
Common mistakes that occur include the use of excessive indicators, using indicators in the absence of market conditions, changing indicators continuously, not having proper risk management practices, and assuming past performance guarantees future results.
2. Can using multiple indicators improve a trading strategy?
Yes, but this is possible only if each indicator has something to say and is unique from one another. The addition of several indicators that measure the same features will complicate things but not enhance the decision-making process.
3. Why can indicator optimization be dangerous?
The repeated adjustment of indicators through performance on past data will lead to overfitting of the model in relation to the historical data. It will result in the strong backtest of the model but poor performance on out-of-sample data.
4. How can traders test whether an indicator is actually useful?
Traders can set its objectives, make rules prior to testing it, evaluate it under various market conditions, conduct tests within reasonable parameter values, and backtest it with out-of-sample data.
5. Should traders stop using technical indicators?
Not necessarily. Indicators can be valuable instruments provided that they help develop an understandable trading approach. The main thing is not to use them as an independent forecast system but analyze their usefulness in the overall approach.