A chart to code trading strategy can transform the traders' visual observations on price charts into rules that can be evaluated by a computer. The trader's observations like “The trend is quite strong” or “This level is quite significant” are converted into verifiable rules. This can include things like a crossover of the moving average, breakouts, levels of support, a volatility filter, or momentum signals.
The hard part is not just coding the programming syntax. The hard part is knowing precisely what information the chart is telling us and eliminating all ambiguities from each and every trade. The proper process would thus take us from visualization to measurement, implementation, historical testing, and controlled refinement.
In this blog you will learn how to test, validate and refine your algorithmic trading strategy.
What Does Chart to Code Mean in Trading?
Chart to Code trading strategy involves taking the interpretation of an observed trading pattern on a chart and converting it to something logical that the computer can process.
For example, the following observations can be made by a trader:
- Price going above a resistance level
- Fast moving average crossing the slower one
- Volume increases during a breakout
- Momentum goes above a certain level
- The placement of a stop below the most recent swing low
A computer cannot comprehend these observations like a human does. Every observation has to be quantified.
For example, “price breaks resistance” could become:
Close > previous resistance level
Likewise, “momentum is strong” needs a measurable indicator, threshold, or price-based calculation.
This distinction matters because a discretionary setup can change from one chart to another, while coded logic should produce the same decision whenever identical conditions occur.
Step By Step Guide: Chart to Code Trading Strategy
Here you will find a proper step by step guide to convert the chart to code:
Step 1: Deconstruct the Chart Setup
Begin by examining the graph instead of starting with the programming language.
Identify each factor that impacts your decision. Divide the set-up into market environment, entry criteria, position management, and exits.
For example, a breakout concept could contain:
| Strategy Component | Example Rule | Why It Matters |
|---|---|---|
| Market condition | Price above 200-period SMA | Defines the broader trend |
| Setup | Price approaches resistance | Establishes the area of interest |
| Trigger | Candle closes above resistance | Creates an objective entry event |
| Confirmation | Volume exceeds its average | Measures participation |
| Stop-loss | Below recent swing low | Defines invalidation |
| Take-profit | 2× initial risk | Establishes a predefined reward target |
| Position sizing | Risk 1% of account | Controls exposure |
This exercise exposes vague assumptions before they become programming errors.
Step 2: Replace Subjective Signals With Numbers
A visual configuration may be easy to identify by a trader but tough for a computer to understand. All visuals need to be converted into conditions that can be measured before writing code.
- Trigger: Specify what you will use as an indicator, price, or chart pattern.
- Thresholds: No vague terms like "strong" or "large." Only numeric numbers.
- Timing: Exactly at what time will the condition become valid?
- Objective: Every rule must lead to a "true" or "false" situation.
Step 3: Select the Right Coding Environment
The selection of the platform should match the complexity of the strategy, data requirements, and execution.
| Factor | Pine Script | Python |
|---|---|---|
| Best for | TradingView-based strategies and chart signals | Advanced research, analytics, and automation |
| Chart integration | Excellent TradingView integration | Requires external libraries or platforms |
| Indicators | Easy to create and test on charts | Highly customizable with libraries |
| Backtesting | Built into TradingView strategies | Flexible and highly customizable |
| External data | More limited | Strong support for multiple data sources |
| Machine learning | Not designed for ML workflows | Extensive ML and data science support |
| Broker integration | Limited | Better suited for custom integrations |
| Learning curve | Relatively straightforward for chart-based systems | Higher, especially for complex workflows |
| Best use case | Simple to moderately complex chart-based systems | Complex quantitative and algorithmic systems |
Select the platform according to the requirements of your strategy, not according to your programming expertise.
Step 4: Build the Entry and Exit Logic
When the rules are quantified, translate them into separate criteria.
If the system needs:
- A bullish long-term trend.
- Price to overcome a certain resistance point.
- The volume to be higher than usual.
- The candle to close above the breakthrough point.
- All of them can be considered as separate logical tests and united in one entry criteria.
Apply this approach to exits as well. The algorithm should understand exactly when the trade becomes invalid, hits its target, faces a trailing-stop situation, or has to be closed because the day of trading is over.
Be careful not to make the first version too complicated. The simpler the baseline, the easier it is to find out which criteria really work.
Step 5: Account for Trading Mechanics
Even a good signal does not guarantee good results for a trading strategy because unrealistic execution assumptions may lead to wrong results.
The things to consider include the following:
- Commission on broker fees
- Bid-Ask Spread
- Slippage
- Position size
- Lot size
- Market session limitations
- Leverage
- Capital available
- Execution timing
One of the examples is the assumption that each trade will be executed right at the closing price of the signal candle.
So, execution assumptions must be made prior to defining the presence of an edge.
Step 6: Use Trading Strategy Backtesting Correctly
A trading strategy backtesting determines how well it would have worked using past market data.
One should never evaluate a system just based on overall profitability. There are other aspects to consider:
| Metric | What It Reveals |
|---|---|
| Net return | Overall historical result |
| Maximum drawdown | Largest decline from a previous peak |
| Win rate | Percentage of profitable trades |
| Profit factor | Relationship between gross profits and losses |
| Average trade | Typical contribution per position |
| Trade count | Whether the sample is sufficiently broad |
| Risk-adjusted return | Return relative to the risk taken |
A high winning percentage does not always mean a good trading strategy. Sometimes, a trading system which often makes a profit but has occasional huge losing trades is less preferable compared to a system with lower frequency but well controlled downside.
Test your trading strategy in varying market conditions instead of choosing just one profitable period for testing.
Step 7: Separate Development From Validation
Overfitting is one of the main risks of systematic trading, which implies that your system is optimized to fit historical data.
- Develop: Create your first set of rules using historical data.
- Optimize: Make only minimal logical changes to your system.
- Test: Run tests based on data not used in the development process.
- Paper-trade: See how your system works under real market conditions but don't risk any money.
- Analyze: Find out whether there is consistency in performance.
Do not optimize parameters again just because you want better results in the past.
How to Improve a Coded Strategy Without Overfitting
Enhance the strategy with logical sense and consistency, rather than with better returns in the past.
- Spot weaknesses: Find out how the strategy underperforms.
- Rational modifications: Make a change to the strategy only if there is a logical market reason for it.
- Single-factor adjustment: Change one meaningful element at a time.
- Measure improvement: Compare the old and modified versions of the strategy objectively.
- Opt for robustness: Prefer consistency in performance regardless of different market environments.
The improved strategy does not have to be the one with the best backtest returns, it has to stay logical and consistent under different market conditions.
A Practical Chart-to-Code Workflow
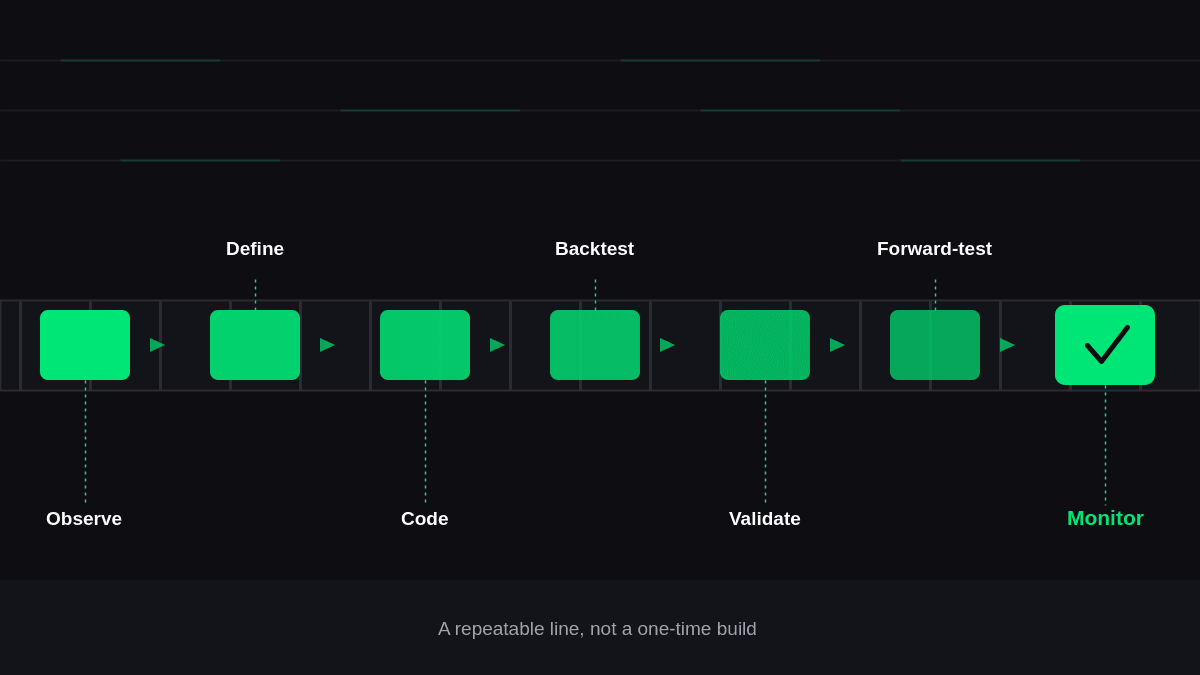
A repeatable process makes strategy development much easier:
Observe → Define → Code → Backtest → Validate → Forward-test → Monitor
First, capture the visual configuration. Second, translate all decisions into criteria that can be measured. Build the minimum viable implementation, and backtest it against past performance.
Once validation is done, simulate the strategy in real life and monitor to see if the signals, fills, costs, and position management match what was expected.
It is only then that one moves on to live trading.
Common Mistakes When Converting Charts Into Code
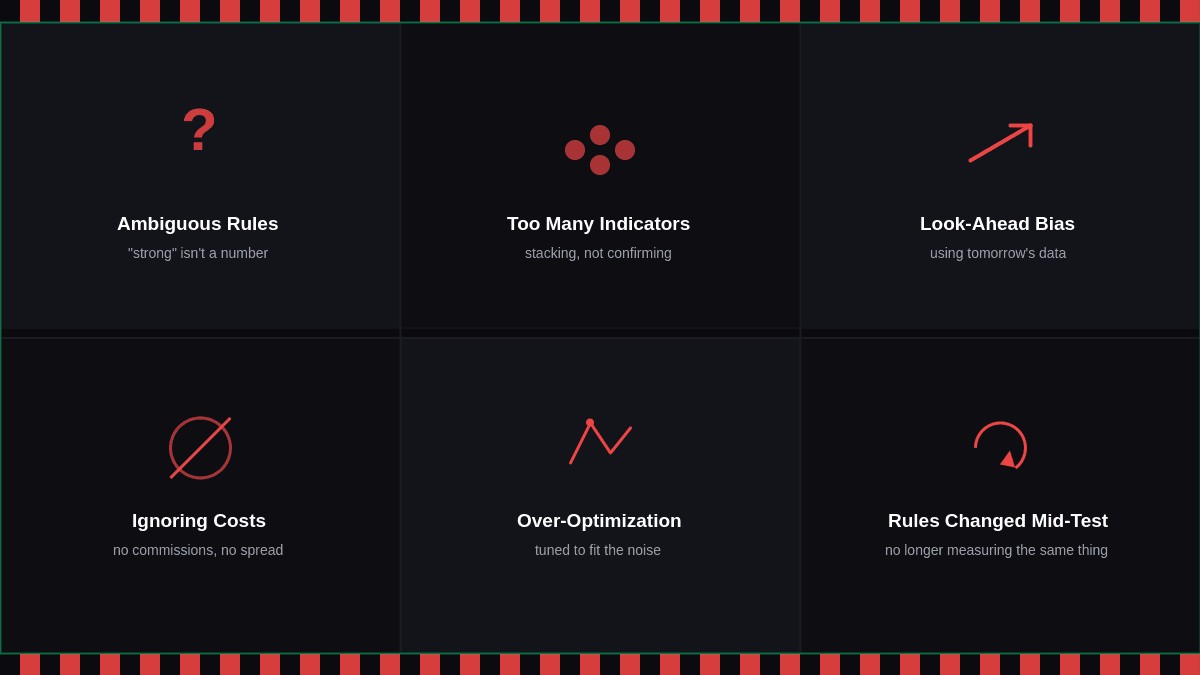
Visual design can lose its meaning in the translation of subjective choices to strict code. Preventing typical coding and testing mistakes is important for maintaining consistency in the approach.
- Ambiguous rule set
- Too many indicators
- Look-ahead bias
- Ignoring trading costs
- Over-optimization
- Changing rules while testing
Conclusion
A chart to code trading strategy cannot simply be done through the copy and paste of chart-based indicators into a program. What is more important is done beforehand: understanding what the set up really needs, stripping away personal interpretation, determining objective signals, and formulating realistic execution guidelines.
With all these established, the coding process is just one way of turning the strategy into something replicable without trying to find the meaning behind the chart.
The back testing will allow one to check the performance based on the historical data, while out of sample testing and forward testing will help to figure out if the rules are still valid outside of the data that helped to formulate them.
The point is not to develop the most complex algorithm. The point is to develop a clear system, in which decision-making processes can be analyzed, tested, and measured.
FAQs
What is a chart to code trading strategy?
It refers to a way of translating the visually designed trading configuration into explicit mathematics and logic that can be coded and back-tested by the computer.
Can I convert a discretionary trading strategy into code?
Yes, assuming the key decisions can be translated into measurable criteria. The use of subjective judgment like “market seems strong” should be substituted by numerical criteria.
Is Pine Script suitable for converting chart strategies?
Pine Script is good at implementing TradingView-based strategies. More sophisticated data analysis or external connections would be better done in Python.
How do I know whether a coded strategy is reliable?
Do not limit your examination to historical profitability. Consider drawdown, number of trades, profit factor, consistency through different market environments, assumptions about execution, and out-of-sample testing.
Can backtesting guarantee future trading profits?
No. Backtesting may be able to show you how a particular set of rules performed in the past but it cannot tell you how it will perform in the future.