Selecting a good trade becomes hard as there are many charts to analyze at once; hundreds or even thousands of them may be involved. With a chart screener, this task will become much easier, as the trader is able to screen charts based on certain criteria instead of having to go through all charts himself/herself.
The real value comes from screening criteria that fit your trading strategy. Movement of price, trend direction, volume, volatility, and technical situation may all be used to determine which charts deserve a closer look.
The best screening process is not one that tells you which trade to make but rather a process that helps you analyze those opportunities that fit your pre-defined criteria. In this blog you will find everything related to chart screener to find better trading opportunities.
What Is a Chart Screener?
Chart Screener is a market analysis tool that filters securities according to specified criteria. The securities that can be screened on certain platforms depend on the platform in question and may include stocks, ETFs, cryptocurrencies, forex currency pairs, and other securities.
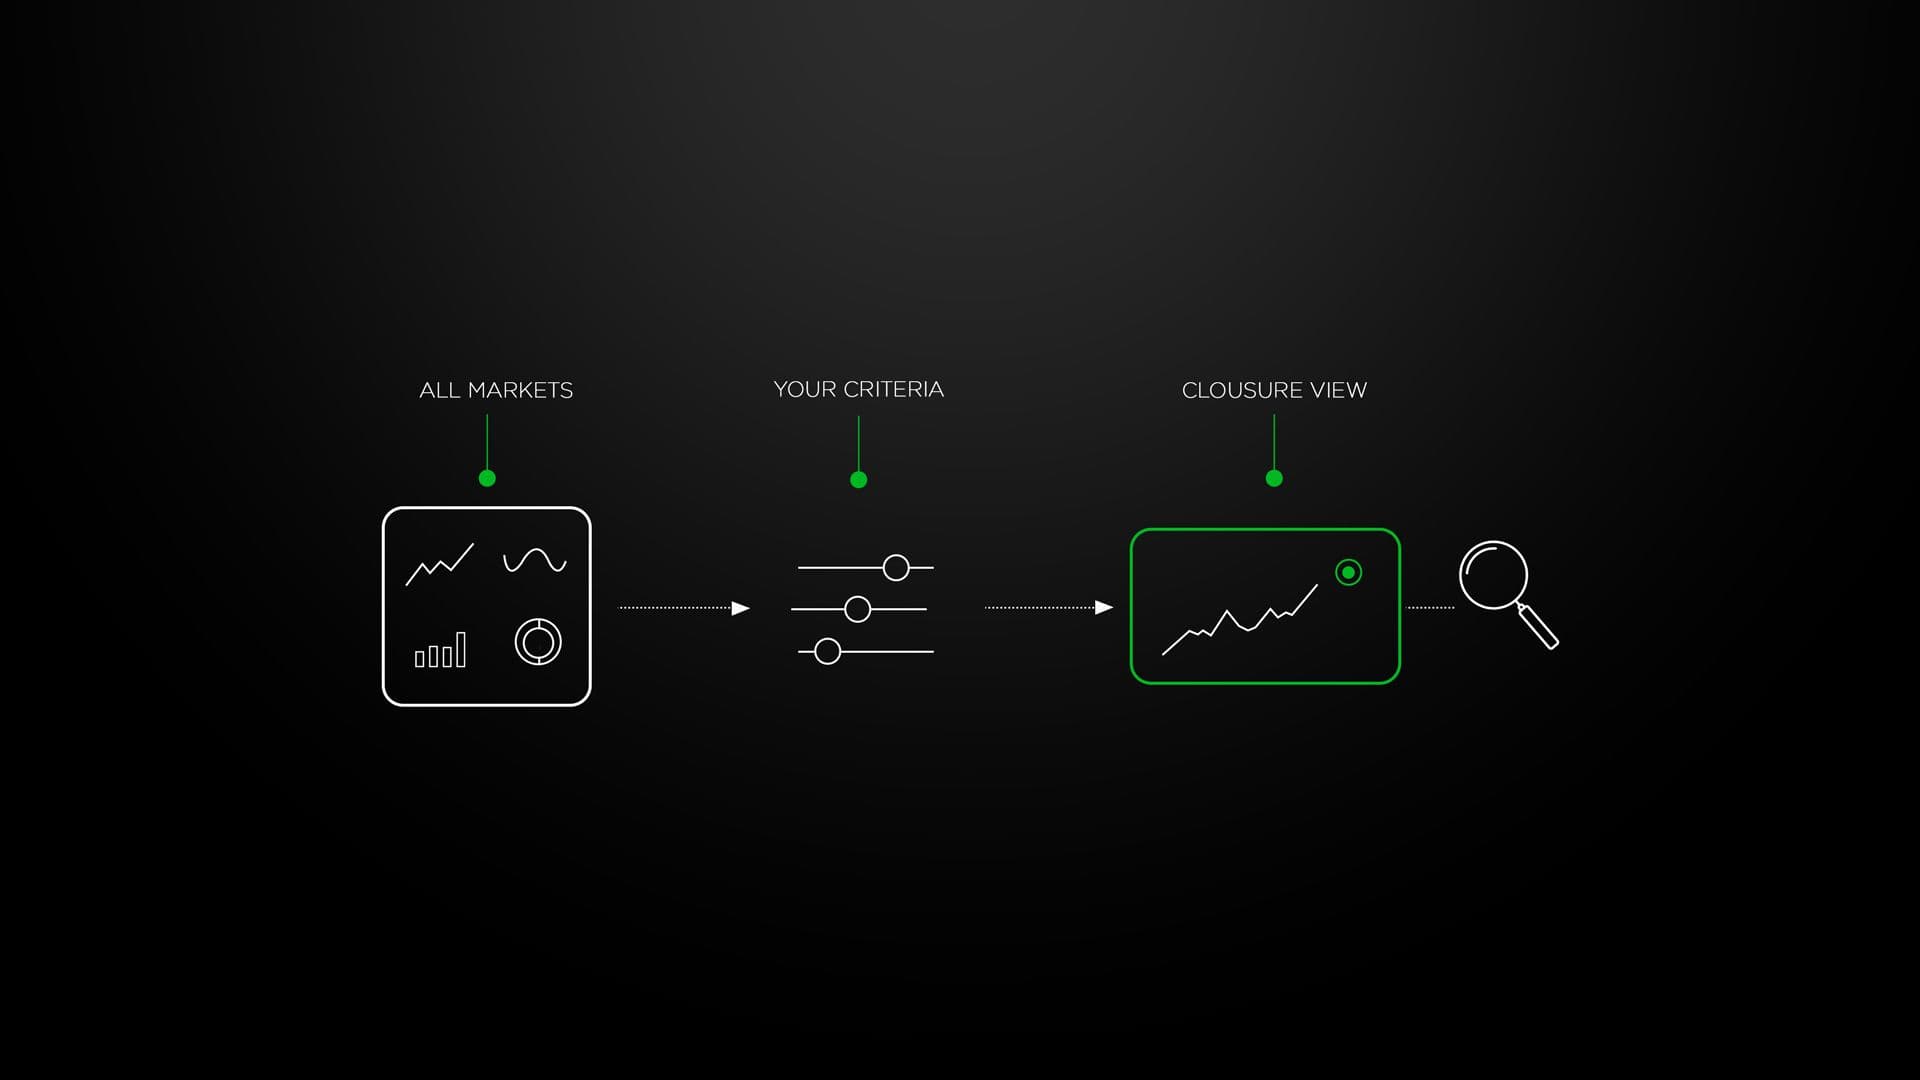
For instance, a trader seeking a momentum play could use a chart screener to find securities demonstrating powerful price movements and higher volumes. A trend-following trader could filter out those securities whose prices are above some moving averages.
The mentioned filtering procedure should not be confused with finding top gainers/losers. An effective stock screener should enable users to set several criteria at once.
Why Screening Can Improve Your Market Research
Checking all these charts manually will be very time-consuming and will prevent traders from capitalizing on available opportunities. By screening, one is able to have an easier starting point by eliminating the unwanted securities from the process.
It can help traders:
- Decrease the quantity of charts which have to be looked through manually.
- Use the same standards in all markets.
- Identify tools with certain technical characteristics.
- Make the comparison of the possible deals easier.
- Create an algorithm for your research process.
However, screening must be considered as a filtering process and not an entire trading system. The output that satisfies several criteria needs to go through further evaluation for any final decision.
Key Filters to Consider When Screening Charts
It all depends on the trading strategy used. Incorporating all possible conditions in the filter will make the screen too restrictive, and thus it is advisable to incorporate only those factors that are relevant to the strategy being examined.
Below you will find key filters to consider when screening the charts:
| Filter | What It Can Show | Why It May Matter |
|---|---|---|
| Price change | Recent upward or downward movement | Helps identify momentum |
| Trading volume | Level of market participation | Can provide context around price moves |
| Moving averages | Relationship between price and trend indicators | Helps assess trend direction |
| Volatility | Size and frequency of price movements | Useful for strategy and risk considerations |
| Market capitalization | Approximate company size | Can narrow a stock universe |
| RSI or similar indicators | Potential momentum extremes | Provides additional technical context |
These filters should not be selected simply because they are available. Each one should have a clear purpose within the trading method.
How to Turn Screened Results Into Trading Setups
The screening result is only the starting point of the analysis. After the list has been filtered, one should analyze each chart to see whether the price structure supports the potential opportunity.
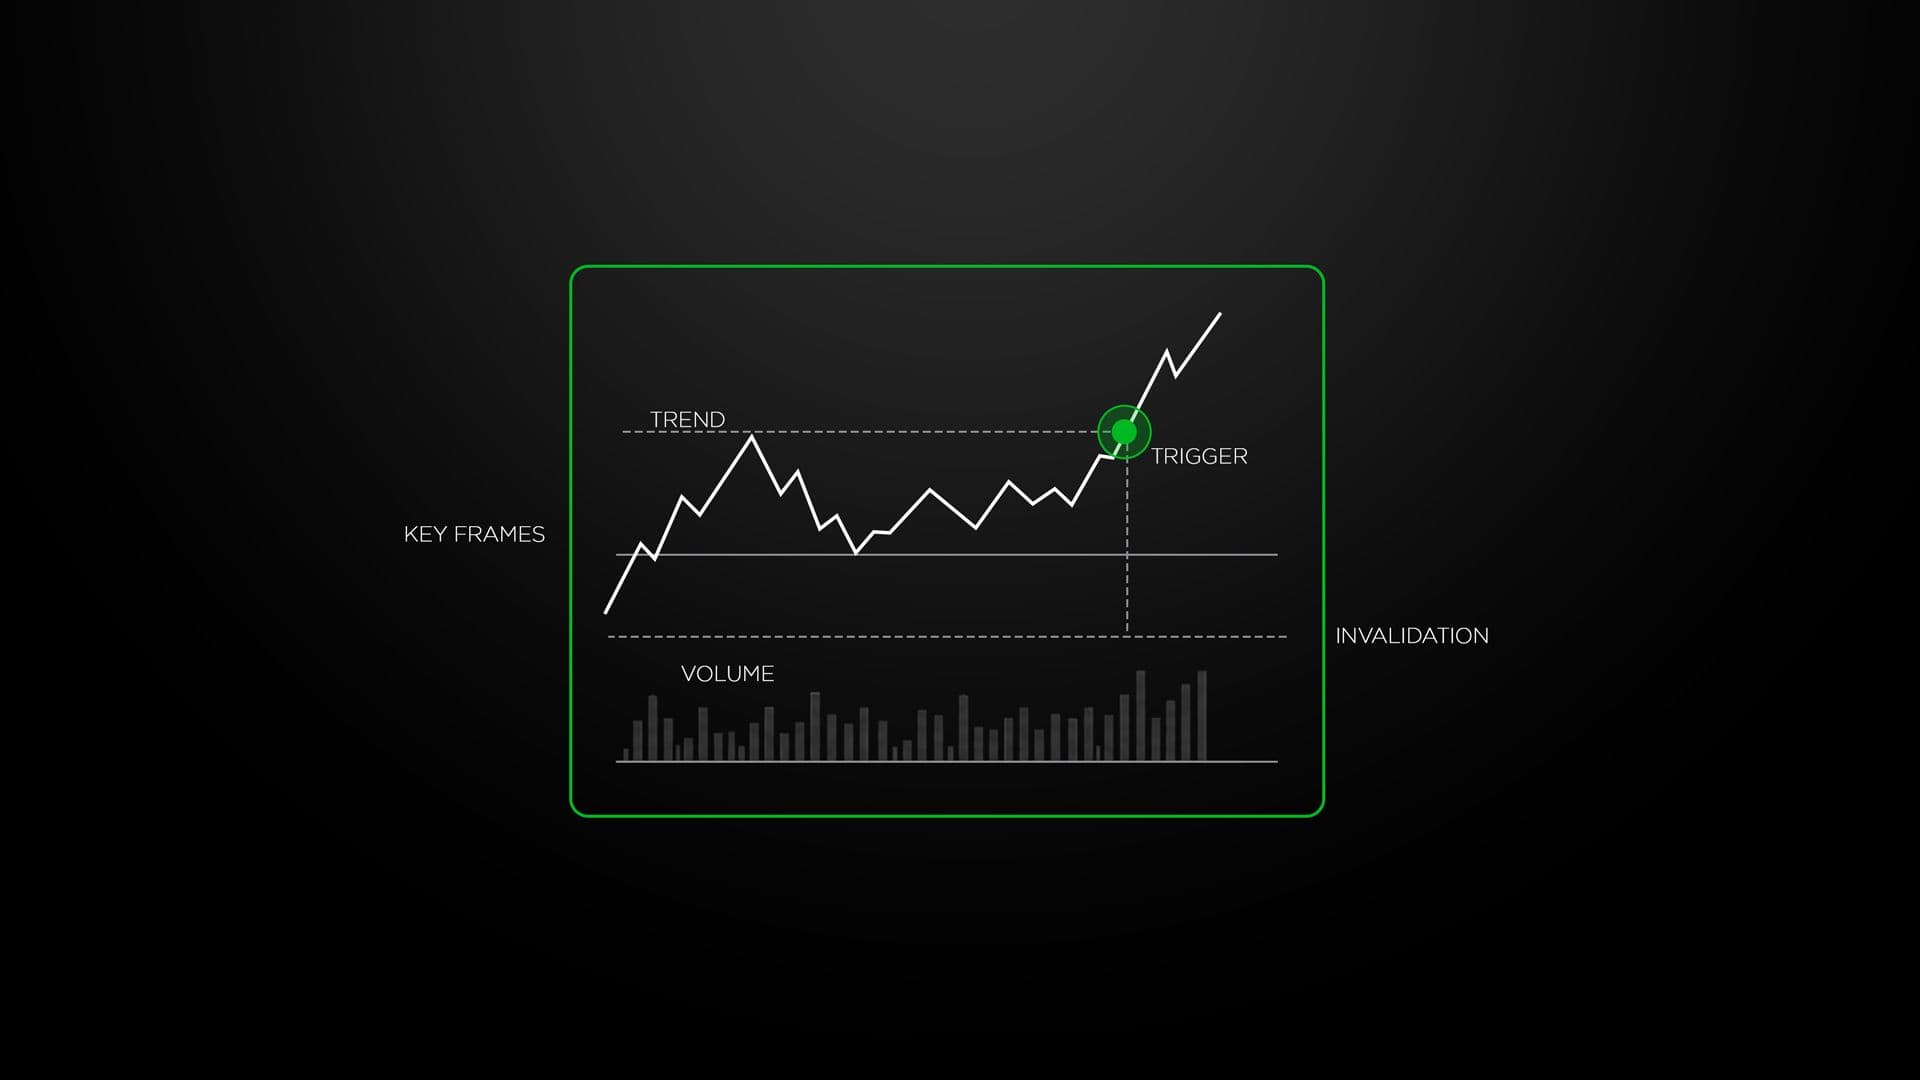
First of all, one should look at the overall trend. Next, one should check for key levels of support and resistance, recent price action, volume, and time frame.
This is when technical analysis proves more useful compared to the screening parameters alone. The chart could pass through a particular filter but be structurally weak, limited room for movement, or an unclear invalidation point.
Before trading any setup, traders may want to ask themselves:
- Does this setup match their strategy?
- Does this trade fit the overall trend direction?
- Is there a level that disproves this concept?
- Does the risk versus reward ratio make sense?
- Is there a trigger point?
These questions help separate interesting charts from actionable opportunities.
Chart Screener vs. Manual Market Research
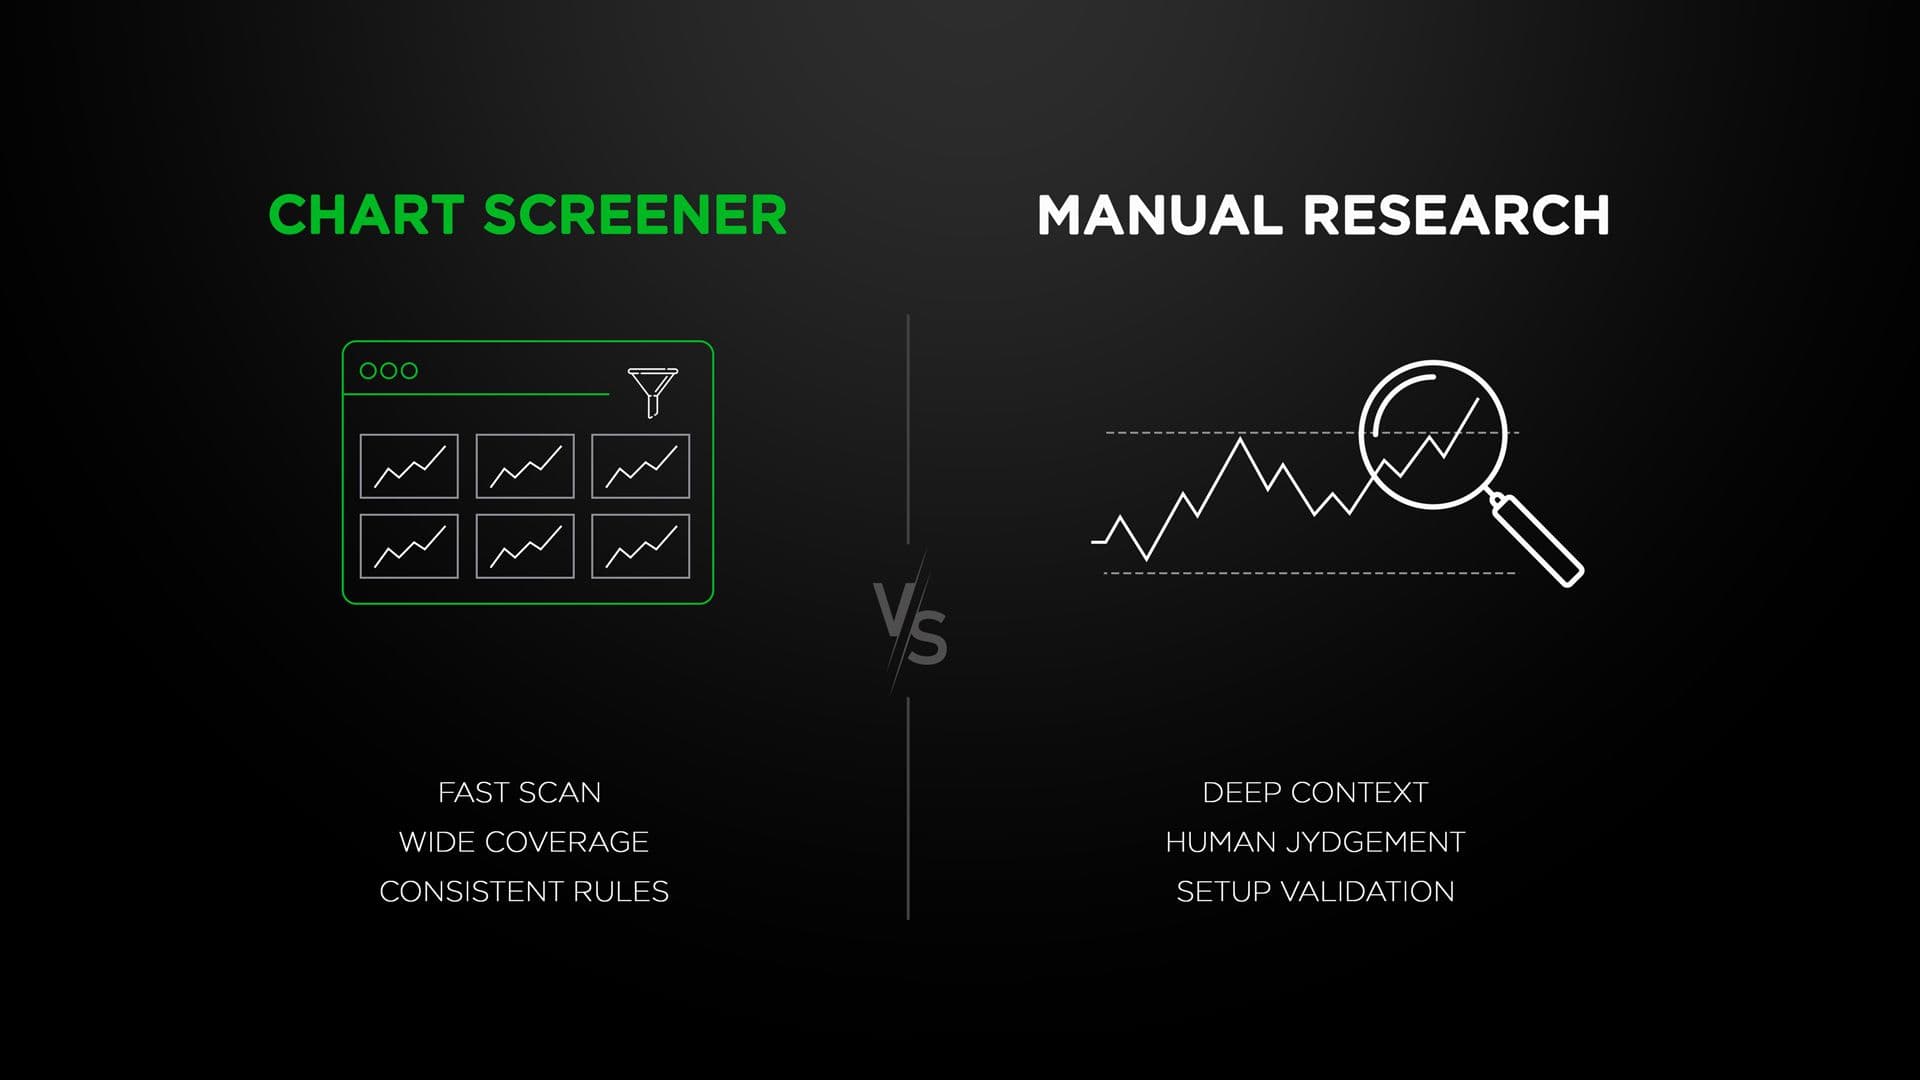
Before going through the steps guide it's important to understand the screening tools and manual research as these both offer two different approaches to the market. The first tool is good for quickly narrowing down the list of choices, while the second offers traders the ability to conduct thorough chart analysis, something that the screening tool would not be able to do.
Combining the two could bring about balance.
| Factor | Chart Screener | Manual Market Research |
|---|---|---|
| Speed | Quickly scans many instruments based on predefined conditions. | Takes more time because charts are reviewed individually. |
| Consistency | Applies the same filters across the selected market. | Results can vary depending on the trader's judgment and process. |
| Market Coverage | Can review a large number of instruments efficiently. | Usually focuses on a smaller selection at a time. |
| Customization | Allows traders to create specific screening conditions. | Offers greater freedom to investigate unexpected market behavior. |
| Technical Conditions | Can identify charts meeting selected indicators or price criteria. | Allows deeper interpretation of price structure and market context. |
| Human Judgment | Requires follow-up analysis after results are generated. | Relies heavily on the trader's experience and interpretation. |
| Best Use | Narrowing a large market into a focused watchlist. | Examining shortlisted charts before making a trading decision. |
The most effective approach is often to use screening for discovery and manual research for validation. This keeps the initial search efficient without relying entirely on automated filters.
Step by Step Workflow for Better Chart Screening
By following a well-defined screening process guide traders can narrow their search from a general market environment down to a watch list without over-complicating the whole process.
Here you will find a proper step by step workflow for better chart screening:
1. Define Your Trading Objective
Firstly, decide what kind of trading opportunities you are searching for, whether a trend continuation, a breakout, a reversal, or momentum trade setup.
2. Select Your Market
Select those assets, industries, markets, or securities that match your approach. By keeping your universe of markets up-to-date, you will ensure more effective screening results.
3. Set Relevant Filters
Use only those conditions which are relevant to your trading method. Look out for important criteria like price action, volume, trend, volatility, or other technical indicators.
4. Analyze the Shortlist
Look at the charts returned by the screener rather than focusing only on the filter results. Consider factors such as price pattern, market trend, level, and general chart behavior.
5. Look for Confirmation
A qualifying chart does not guarantee you entry. It is necessary to wait for the confirmation signal needed according to your trading strategy.
6. Assess Risk and Invalidation
Determine what level will make the whole arrangement invalid and assess if the possible opportunity will justify the intended risk.
7. Build a Watchlist
The best candidates should be watched closely for the conditions needed to implement your strategy. This will avoid hasty moves and keep you organized.
Using the above guidelines makes chart screening a process of organized research as opposed to hunting for random trading signals.
Common Mistakes When Using a Screener
A chart screener can make market research faster, but the quality of the results depends on how the filters are selected and interpreted. Avoiding common screening mistakes can help keep the process focused and aligned with the trading strategy.
- Using too many filters
- Treating screener results as trade signals
- Relying on a single indicator
- Changing filters to get desired results
- Ignoring the broader market trend
- Skipping risk assessment
- Focusing only on short-term price movements
Conclusion
A chart screener can help in saving time in market research by narrowing down a lot of instruments based on the criteria that are important to a specific strategy. Rather than going through all the charts available, it will allow the trader to create a shortlist of those that are most appropriate.
This is where the best results are seen when screening becomes part of a larger process. This includes defining the strategy, applying filters, evaluating charts, waiting for confirmation, and risk evaluation before deciding.
When done in this manner, the screener does not replace the trader's judgment; it allows traders to apply this judgment to areas that are more pertinent to their trading strategy.
Frequently Asked Questions
1. What is the main purpose of a chart screener?
Its main objective is to reduce a big market into a narrower one based on certain criteria. This will save time when doing the research and traders will have a narrower list to do a follow-up study.
2. Can a chart screener predict which trade will be profitable?
No. A screener finds the instruments that fit the chosen criteria, but it cannot determine the price movement after that. The trader should assess everything else as well.
3. How many filters should I use?
There are no such things as a universal number. Begin with those criteria that are crucial for your strategy. Extra filters may make the screen too narrow and exclude valuable options.
4. Is a chart screener useful for beginners?
Yes, as long as it is used for research purposes and not merely as a signal generator. Novices may apply filters to understand how the market looks in various chart configurations.
5. Should I use a screener before performing technical analysis?
The process of screening can be done first as it will reduce the number of charts to be analyzed later. These screened results will then undergo technical analysis based on the particular strategy of the trader.