Backtest metrics allow traders to assess the strategy’s performance based on historical data. Considering just the overall return of a strategy will create an inaccurate assessment since two similar strategies may have different levels of risk and reliability.
A more comprehensive approach should take into account the profitability, loss, drawdown, and risk-adjusted measures. Knowledge of these indicators will be beneficial for backtest analysis and strategy performance assessment.
In this blog you will explore top 7 metrics for backtesting results that can allow traders to make the most right decision.
Why Backtest Performance Metrics Matter
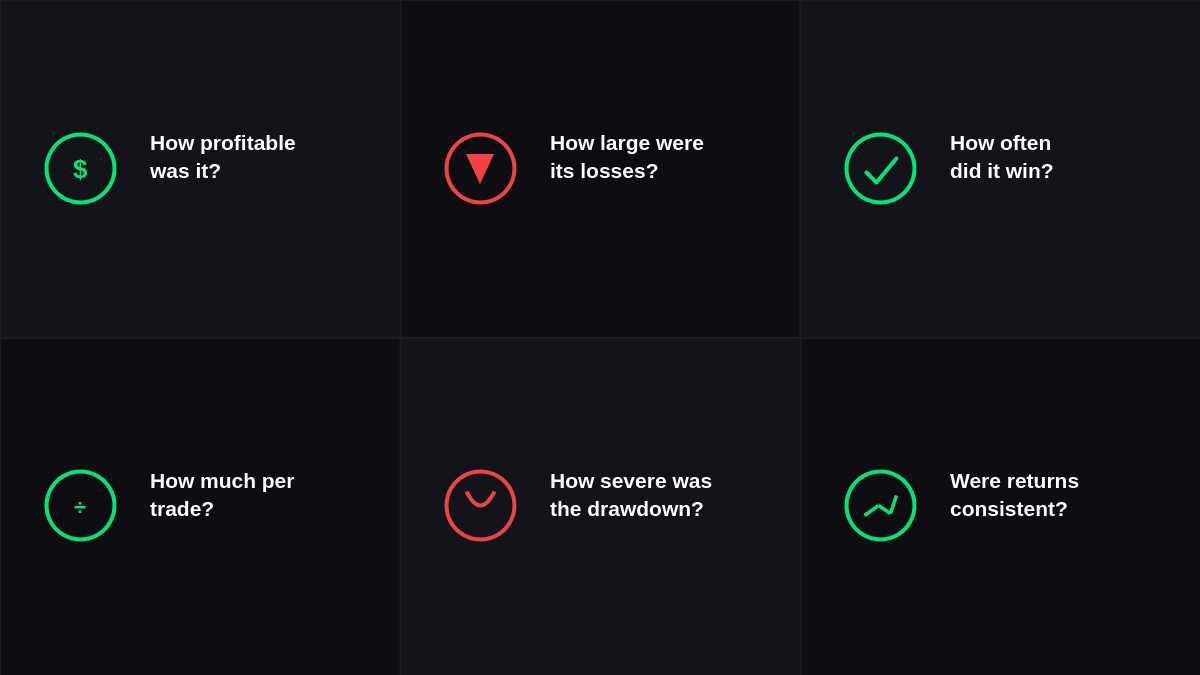
A backtest does not yield just profit or loss. Properly measuring the system can help explain how the system made its money and how risky it was.
Traders need to consider before evaluating a trading strategy:
- How profitable was it?
- How large were its losses?
- How often did it win?
- How much did it earn per trade?
- How severe was its largest drawdown?
- Were the returns consistent?
No single metric provides all the answers, which is why several measurements should be reviewed together.
7 Metrics To Consider For Backtesting Results:
Here you will find all the top metrics for backtesting results that can help you make the right decision:
1. Net Profit
Net profit represents the total amount gained or lost by the strategy during the testing period.
It is one of the simplest trading strategy performance metrics, but it should not be the only one considered.
A strategy producing $20,000 may initially look successful. However, if it experienced a $25,000 drawdown before reaching that result, the risk involved may be unacceptable.
When reviewing net profit, consider the starting account size, percentage return, number of trades, testing period, and trading costs.
2. Maximum Drawdown
Maximum drawdown measures the largest decline from an account's previous peak to a subsequent low.
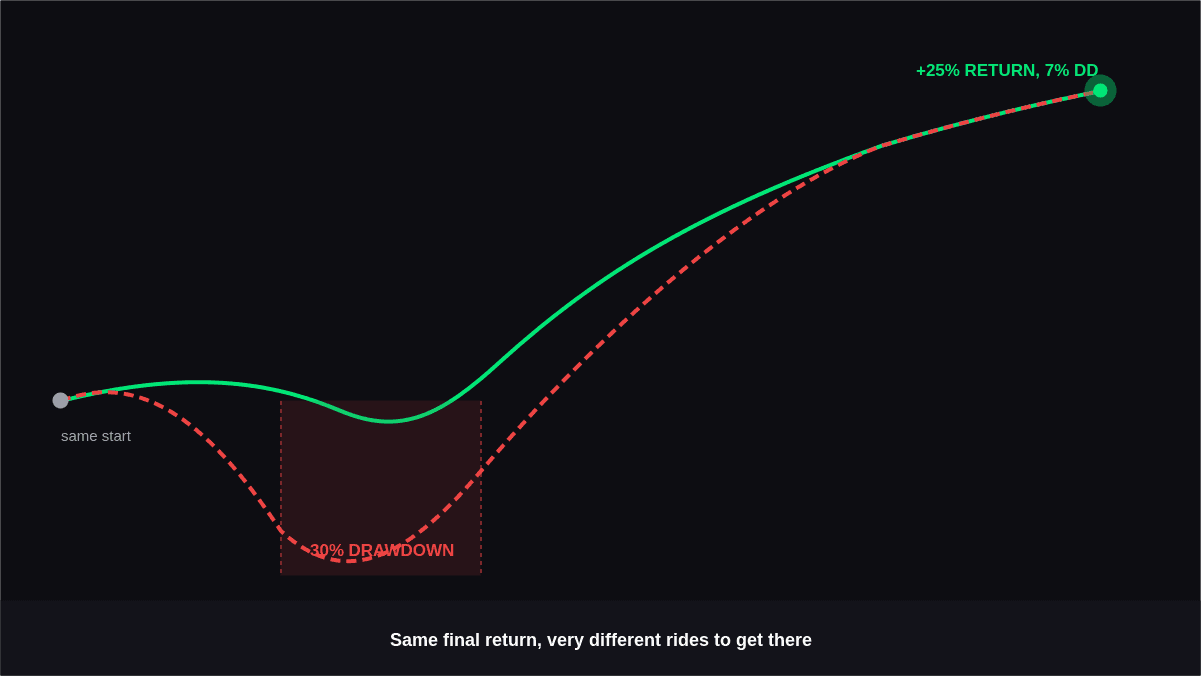
This metric provides an important view of downside risk.
For example, two strategies could both produce a 25% return. One might experience a 7% maximum drawdown, while another falls 30% before recovering. Their final returns are similar, but their risk profiles are very different.
Drawdown duration can also matter. A smaller decline that takes a long time to recover may still be difficult for a trader to tolerate.
3. Win Rate
Win rate is the percentage of trades that close profitably.
Win Rate = Winning Trades ÷ Total Trades × 100
If a strategy wins 60 out of 100 trades, its win rate is 60%.
A high win rate does not automatically mean a strategy is profitable. If losing trades are much larger than winning trades, frequent wins may still result in an overall loss.
Similarly, a strategy with a lower win rate can be profitable when its average winning trades are substantially larger than its losses.
For this reason, win rate should be reviewed alongside average win, average loss, and profit factor.
4. Profit Factor
Profit factor compares gross profits with gross losses.
Profit Factor = Gross Profit ÷ Gross Loss
For example, $18,000 in gross profit and $9,000 in gross losses produce a profit factor of 2.0.
A value above 1 means gross profits exceeded gross losses during the backtest. However, a high value alone does not prove that a strategy is robust.
The result should be considered alongside the number of trades, drawdown, testing period, and realistic execution costs.
5. Average Trade
Average trade shows the average profit or loss generated by each completed trade.
Average Trade = Net Profit ÷ Number of Trades
Suppose a strategy earns $5,000 from 500 trades. Its average trade is $10.
This figure is particularly useful when evaluating transaction costs. A strategy with a very small average trade may lose much of its theoretical profit once commissions, spreads, and slippage are included.
6. Sharpe Ratio
The Sharpe ratio measures returns relative to the variability of those returns. It is commonly used to assess risk-adjusted performance.
A higher Sharpe ratio generally indicates that a strategy generates stronger returns relative to its return variability, assuming the same calculation method is used.
However, there is no single Sharpe ratio that automatically determines whether a strategy is good. Traders should consider the asset, timeframe, testing period, and strategy type when interpreting it.
7. Recovery Factor
Recovery factor compares net profit with maximum drawdown.
Recovery Factor = Net Profit ÷ Maximum Drawdown
For example, a strategy generating $30,000 in net profit with a $10,000 maximum drawdown has a recovery factor of 3.
This provides a simple way to evaluate historical profitability relative to the largest decline experienced by the strategy.
Like other metrics, recovery factor should not be viewed independently. A strong value from a short or heavily optimized backtest may not indicate reliable future performance.
Final Thoughts
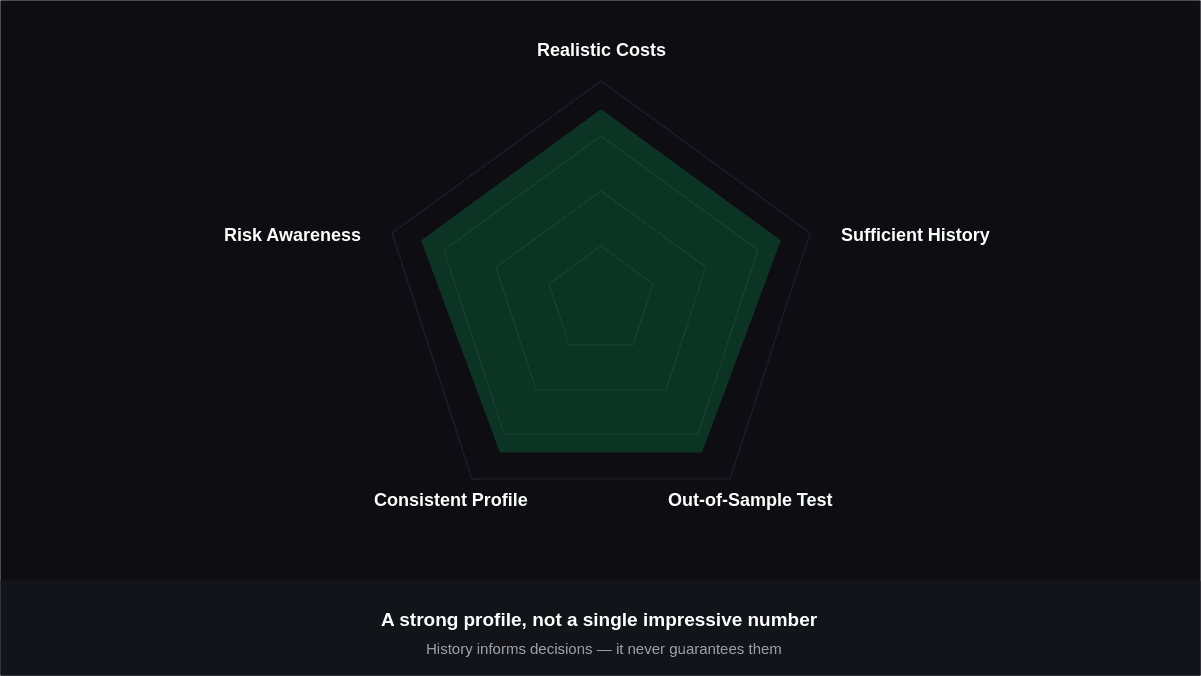
Backtesting metrics give traders an opportunity to consider more than pure profit when assessing a strategy. Net profit indicates the bottom line, and maximum drawdown points out the downside risk. Win rate, profit factor, average trade, Sharpe ratio, and recovery factor contribute more information to the analysis of the strategy performance.
One must not try to select a strategy that has the most impressive single indicator. The traders need to identify the performance profile of a strategy that is backed by realistic costs, adequate amount of historical data, and testing on the unknown data.
High-quality backtesting outcomes of a trading strategy can give valuable information about the strategy, but it will not ensure future profits. Nevertheless, the evaluation process can help traders make more reasonable decisions about testing of particular strategies.