An oscillator matrix provides traders with a convenient method to view various momentum oscillators without having to switch back and forth between different indicator screens. Rather than depending on just one indicator, traders get the ability to analyze the behavior of various oscillators and see whether they agree or disagree with the market situation.
This method allows traders to conduct technical analysis in an orderly manner, especially during periods of pullbacks, breakouts, consolidations, or even reversals. It does not matter how many indicators a trader uses. It is all about analyzing what their readings mean for the market situation.
What Is an Oscillator Matrix?
Oscillator matrix is a graphical or analytical tool that arranges readings from multiple oscillators within one system.
Some of the common elements are:
- Relative Strength Index (RSI)
- Stochastic Oscillator
- Commodity Channel Index (CCI)
- Williams %R
- Moving Average Convergence Divergence (MACD)
These tools have different ways of calculating momentum, but still they can give similar readings on buying and selling pressures and shifts in the market strength.
With the help of this tool traders can compare these readings instead of using each one as a separate decision maker.
Why Use an Oscillator Matrix in Trade Analysis?
Though one particular indicator could be quite informative, it might also send out false signals due to changes in market circumstances.
For instance, RSI might suggest a strong upward momentum, but an oscillator could reveal that this momentum is beginning to decrease. Both values should be considered at the same time.
Oscillator Matrix can assist with:
- Comparison of various momentum values
- Establishment of concurrence among indicators
- Identification of contradictory signals
- Tracking of momentum changes
- Supplementation of trading system
- Elimination of poor trades
The important distinction is that the matrix improves context, not certainty.
How an Oscillator Matrix Combines Momentum Indicators
Different momentum indicators react to price movements differently. Some momentum indicators emphasize relative strength, whereas other indicators compare the current price with the range of recent prices or analyze momentum using moving averages.
A simple matrix might look like this:
| Indicator | Primary Focus | Bullish Condition | Bearish Condition |
|---|---|---|---|
| RSI | Relative momentum | Rising strength | Falling strength |
| Stochastic | Recent price range | Bullish crossover | Bearish crossover |
| CCI | Price deviation | Moving above key levels | Moving below key levels |
| Williams %R | Momentum extremes | Moving away from oversold | Moving away from overbought |
| MACD | Momentum and trend | Bullish crossover | Bearish crossover |
The purpose of this table is not to make every indicator agree. Instead, it gives traders a consistent framework for identifying alignment and disagreement.
Oscillator Matrix vs. Using One Indicator
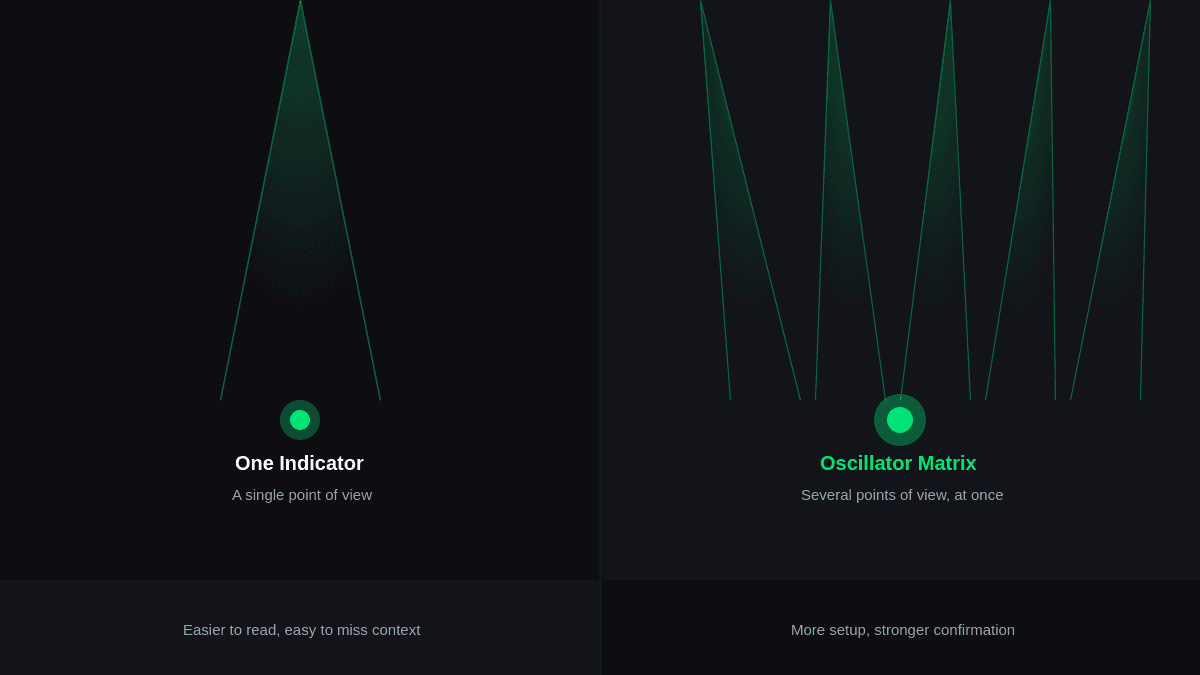
Before getting into the steps, there is something that should be known about the differences: how much market information you evaluate at once. An oscillator gives one point of view on price action, while an oscillator matrix gives you more readings at the same time.
To understand the difference in detail read the given table below:
| Factor | Oscillator Matrix | One Indicator |
|---|---|---|
| Information | Combines readings from multiple indicators or settings | Provides a single market perspective |
| Signal Comparison | Makes agreement and disagreement between readings easier to see | Offers limited comparison |
| Confirmation | Can provide stronger confirmation when signals align | Relies mainly on one signal |
| Complexity | Requires more setup and clear rules | Easier to understand and use |
| Decision-Making | Helps evaluate market conditions from several angles | Encourages decisions based on one reading |
| Risk of Conflicting Signals | Multiple readings may produce mixed signals | Fewer signals, so less internal conflict |
| Best Use | Traders who want broader confirmation before entering | Traders who prefer a simple, focused approach |
Step by Step Guide on How to Read an Oscillator Matrix
Reading the matrix effectively requires looking at the overall picture instead of reacting to a single reading.
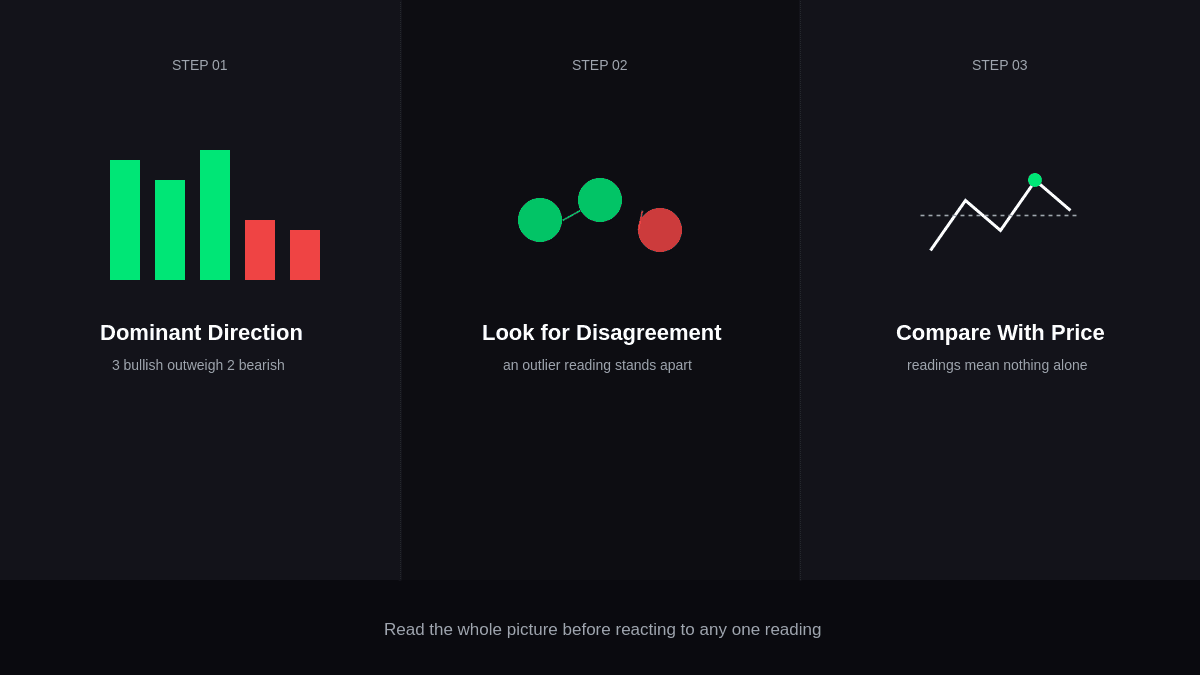
1st Step: Start With the Dominant Direction
To begin with, find out whether the majority of your readings favor bullish, bearish, or neutral momentum.
If several indicators are getting stronger while price is forming higher highs and lows, the readings may confirm the current trend.
If the majority of indicators are getting weaker while price structure is deteriorating, selling pressure needs to be given more attention.
2nd Step: Look for Disagreement
Conflicting readings are not always an error.
For example, suppose that three readings suggest increasing momentum, but two are trending downward. Such an inconsistency might suggest that momentum is losing its consistency.
Rather than taking a trade based on this information, the trader can take some more time to confirm the signal from price action or elsewhere in the trading process.
3rd Step: Compare Readings With Price Structure
Charts should always be considered when interpreting indicators.
Consider if the matrix correspond to:
- Direction of trend
- Support and resistance
- Swing highs and lows
- Breakout formation
- Volume action
- Patterns of candlesticks
A collection of bullish oscillator readings does not necessarily justify a long position if price is directly below significant resistance.
Using an Oscillator Matrix for Trade Confirmation
One of the most practical applications is trading signal confirmation.
Let’s suppose that the price is pulling back towards the existing level of support. With your trade setup, this implies that buying interest might develop at this level. The oscillator matrix will indicate improved momentum on many of the indicators.
This could validate the initial setup.
Inversely, a similar scenario could prove useful too. Suppose that the price has moved towards the level of resistance, and the momentum numbers are deteriorating.
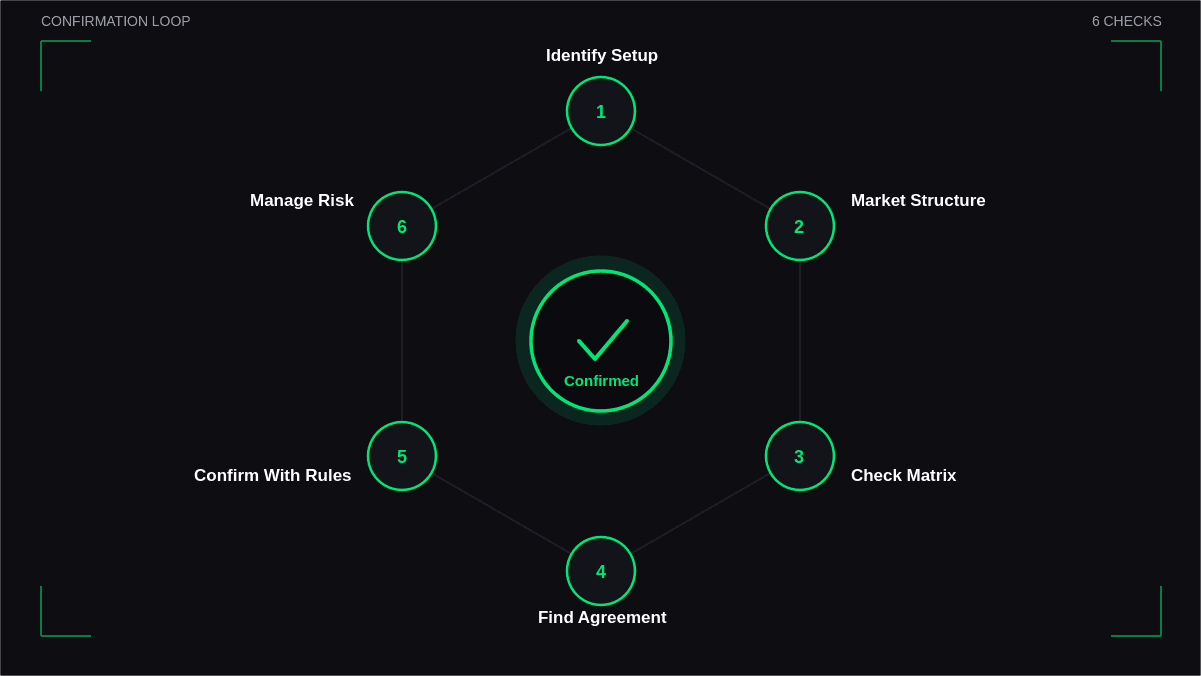
This creates a more disciplined process:
- Identify a potential setup from price action.
- Examine the broader market structure.
- Check the oscillator matrix.
- Look for agreement or meaningful divergence.
- Confirm the setup using your predefined rules.
- Apply appropriate risk management.
The matrix supports the process; it does not replace it.
Build a Practical Oscillator Matrix
An efficient matrix is the one which can be understood at first sight.
First of all, select a set of related indicators. Make sure not to overload the matrix with similar tools.
Then, outline what would be considered a relevant reading for your approach. For instance, the following categorization could be used:
- Bullish
- Bearish
- Neutral
- Strengthening
- Weakening
Then you can compare those classification in the past chart.
Backtesting is one of the crucial steps. An attractive strategy seen in a live chart may not be consistent when tested in varying market conditions.
Common Mistakes Traders Should Avoid
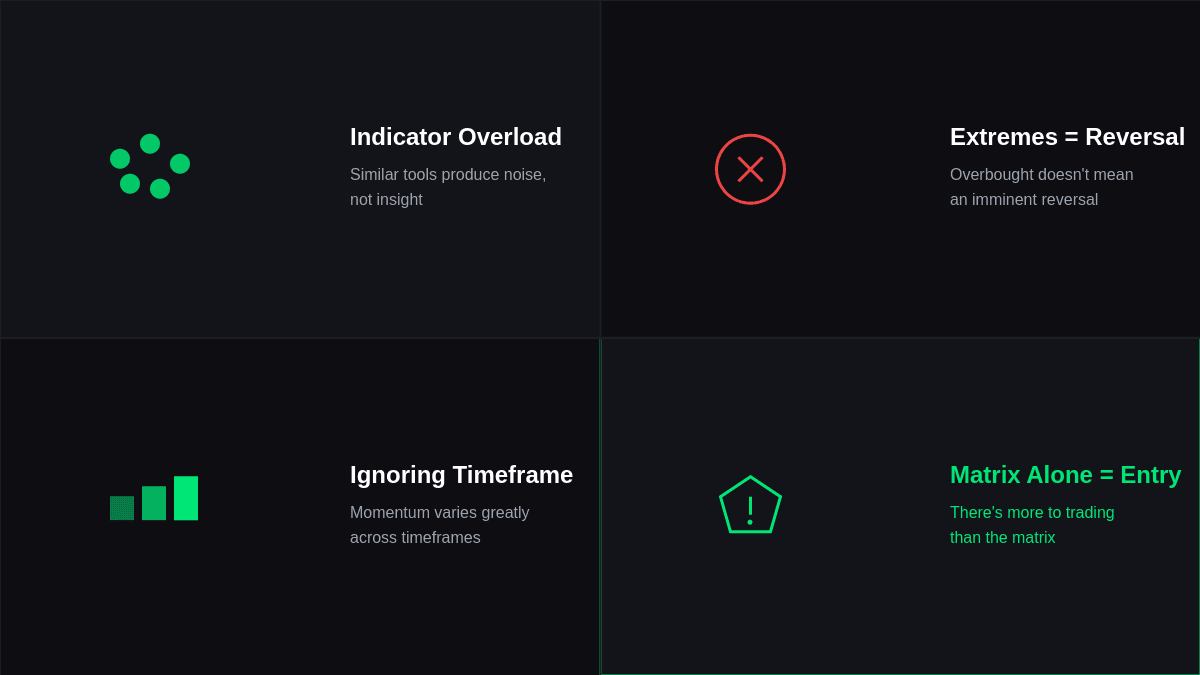
Before using an oscillator matrix, it is crucial for the traders to be aware of the potential mistakes that could affect the accuracy of their analysis.
- Indicator overload: An excess of similar indicators will produce noise rather than insight.
- Taking extremes as signals to reverse course: Overbought/oversold does not imply an impending reversal of price action.
- Not factoring in timeframe: Momentum varies greatly on different time frames.
- Entering based solely on the bullish nature of the matrix: There is more to trading than the matrix.
Final Thoughts
An oscillator matrix can help traders organize their trade analysis through the incorporation of several momentum indicators in one system. However, the true value of the matrix is shown when it helps understand whether the different signals point to the same market environment or increasing market uncertainty.
One should use the oscillators matrix as an additional check on one’s trade idea rather than an entry strategy itself. The oscillator matrix should be used together with price structure, significant levels, trend analysis, and risk management.
Frequently Asked Questions
1. What is the main purpose of an oscillator matrix?
Its main function is to arrange and compare various oscillator readings in order to help traders analyze momentum situations better.
2. Which indicators work well in an oscillator matrix?
RSI, Stochastic, CCI, Williams %R, and MACD are popular technical indicators. The optimal choice is based on the strategy and market being analyzed.
3. Does an oscillator matrix provide guaranteed trading signals?
No. It can be used to detect shifts in momentum but no indicator system is able to predict price direction.
4. Should every indicator in the matrix agree before entering a trade?
Not necessarily. Demanding full agreement can make traders miss out on good setups. The better way would be for testing to determine acceptable confirmation requirements.