Using price action theory provides traders with an effective method to analyze the motion of the markets without relying solely on indicators. Analyzing the ways that price swings form, reacts to significant levels, reverses, and generates trends allows a trader to understand what’s going on in the chart better.
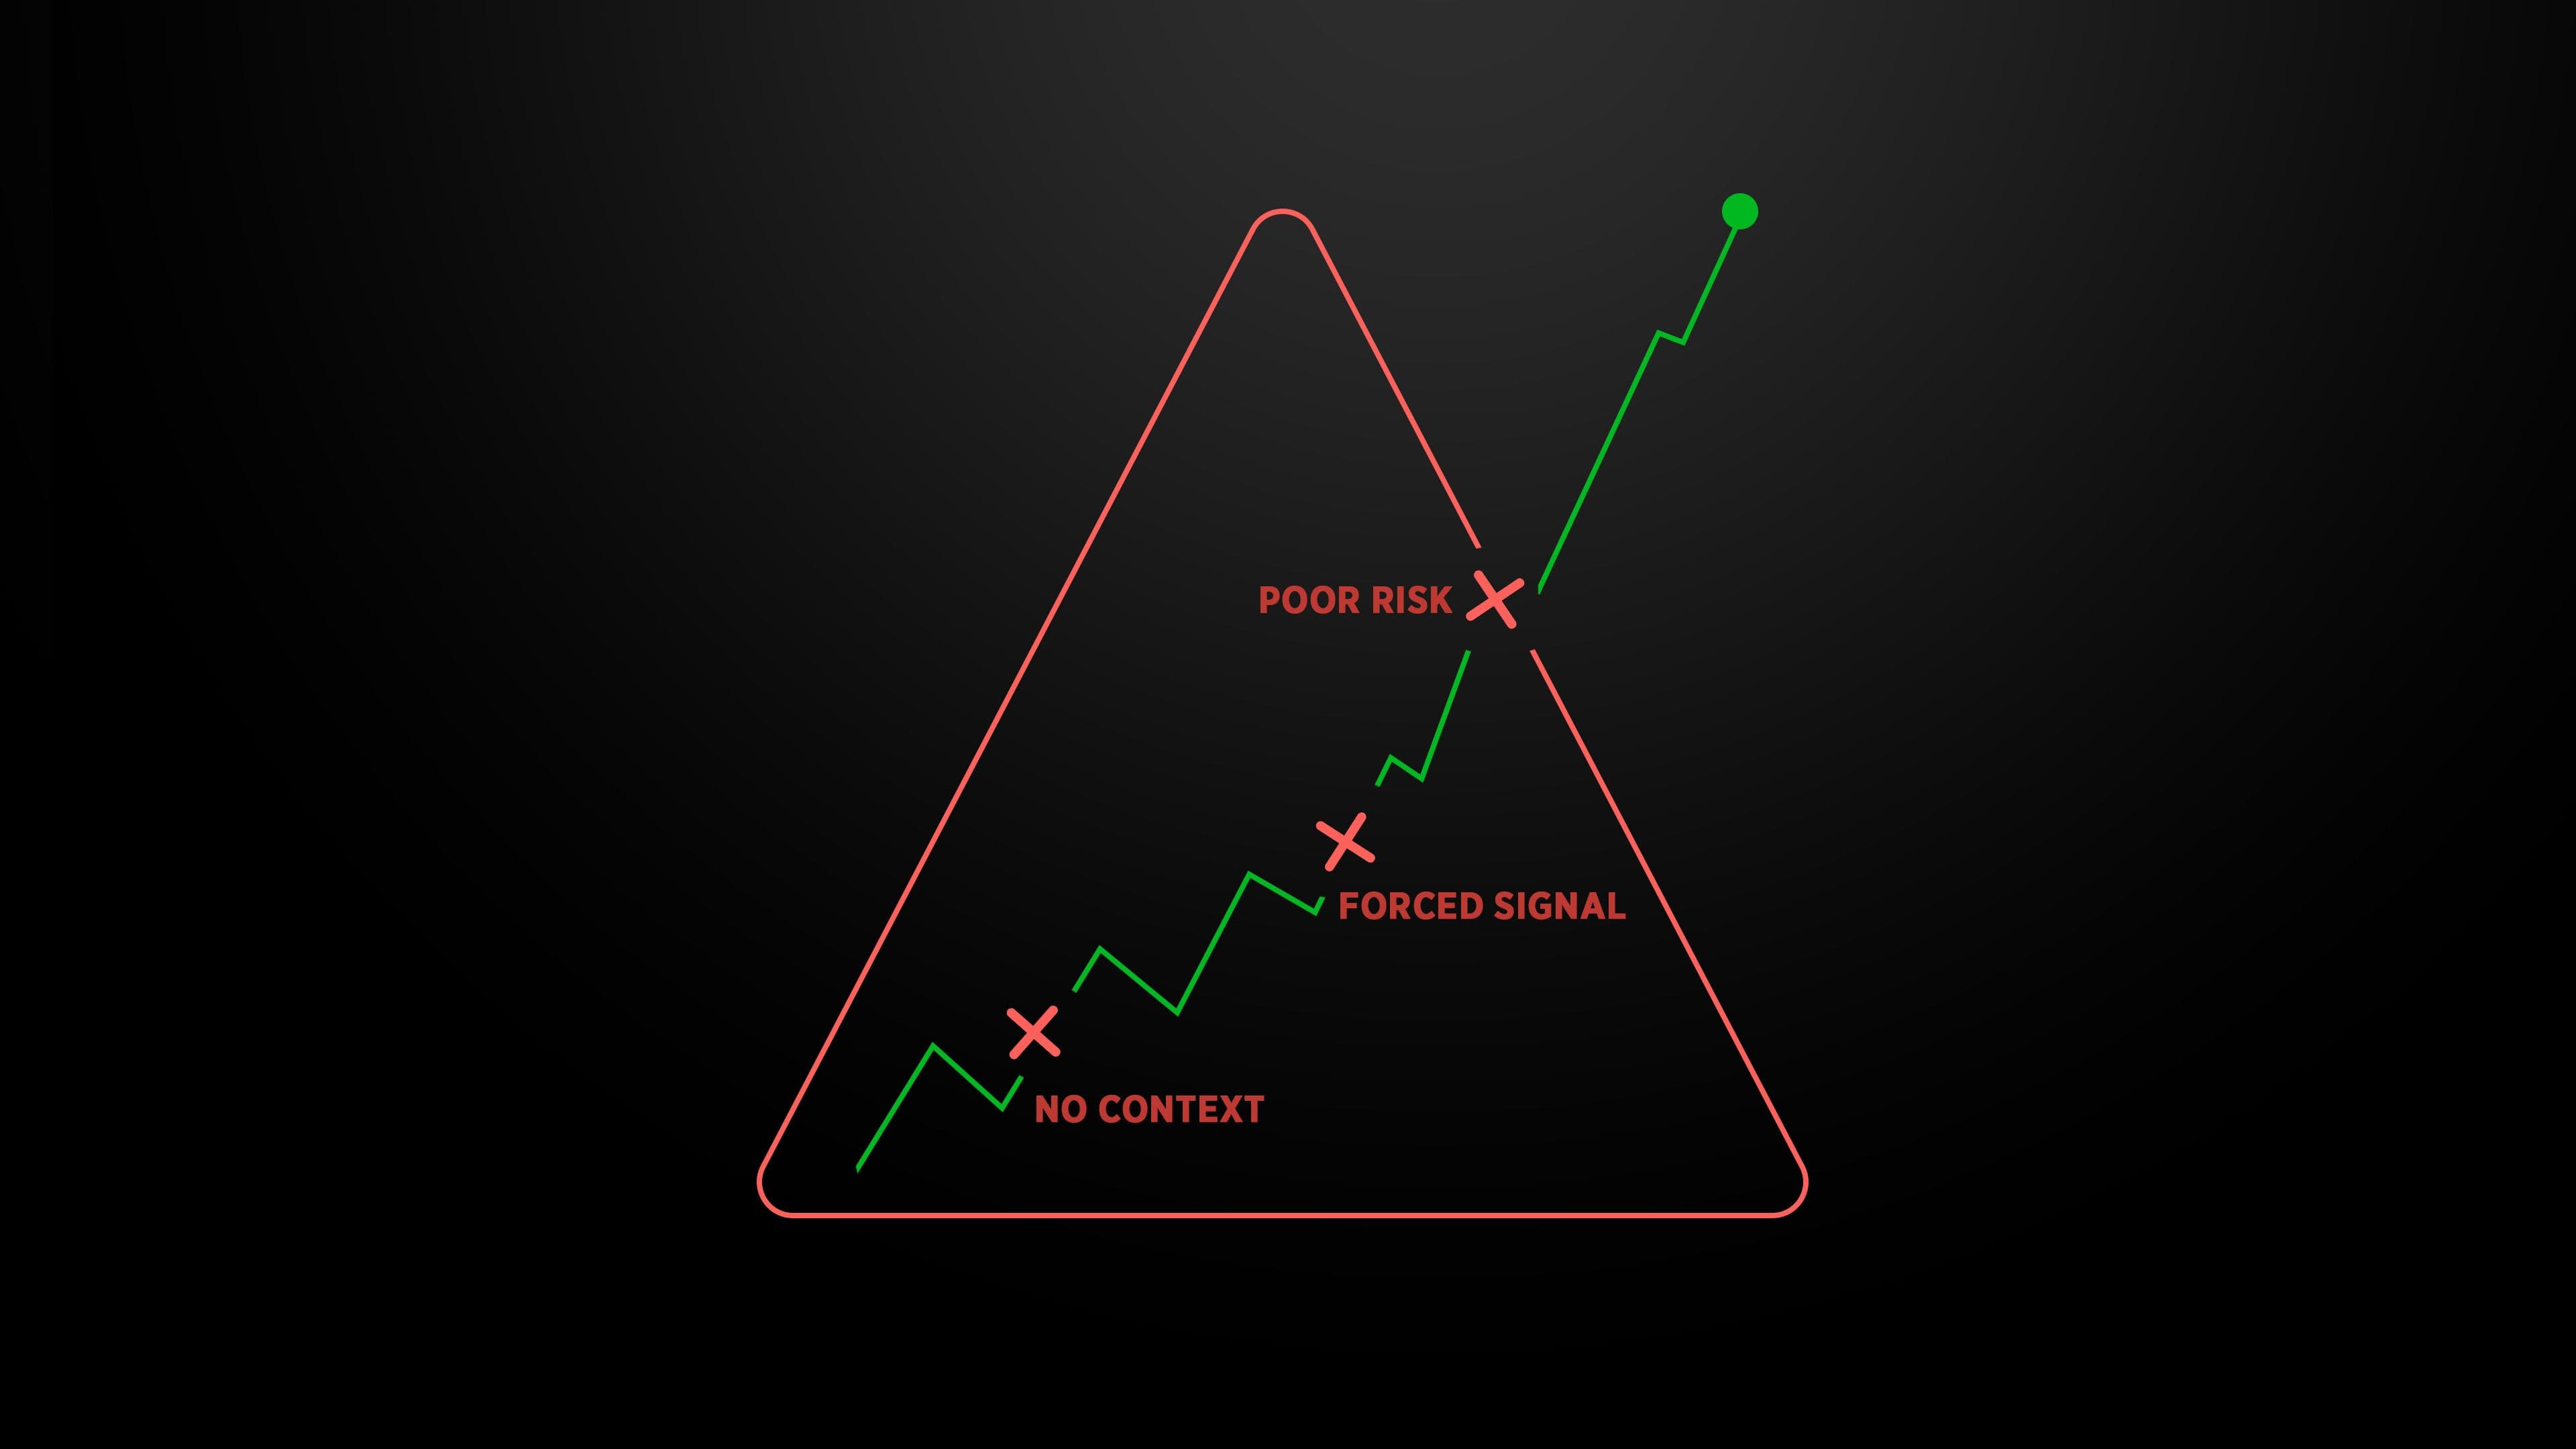
It is not about forecasting everything; it is about organizing the data and understanding when specific conditions appear that may lead to making the defined trading decisions. In this tutorial, we will analyze 10 crucial concepts of price action analysis.
1. Market Structure
Market Structure refers to how price forms a series of high and low prices.
A trending-upward market will tend to form high-highs and high-lows. A trending-downward market will usually form low-highs and low-lows. The sideways market is formed when price tends to bounce within defined levels.
| Structure | Typical Sequence | What it can indicate |
|---|---|---|
| Bullish | Higher highs + higher lows | Buyers maintaining directional control |
| Bearish | Lower highs + lower lows | Sellers maintaining directional control |
| Range | Repeated highs + lows | Limited directional control |
| Transition | Structure begins changing | Possible shift in conditions |
Understanding structure provides context before examining individual candles or setups.
2. Swing Highs and Swing Lows
Swing points are points in the local area where prices reverse direction.
A swing high is identified through a point of temporary highs, whereas a swing low is identified through a point of temporary lows. These comparisons can help traders to decide whether the market is preserving its present pattern.
For instance, when an uptrend is generating higher swing lows, then buyers are holding the bigger trend.
Swing points may be used by traders to:
- Recognize directional patterns
- Find past swing zones
- Detect structural shifts
- Create rational chart references
Not every little swing is equal in importance. It all depends on the timeframe and context.
3. Support and Resistance
Support and resistance mark areas where price action strategy previously met with either buyers or sellers.
Support is normally established in an area where falling prices have met with buyers. Resistance may be formed in areas where rising prices were consistently met by sellers.
This must usually be viewed as zones rather than exact lines.
While analyzing one, take into account:
- The strength of the reaction to price in the past
- If the area has been repeatedly probed
- The distance covered by the price from the reaction
- What will happen when the price comes back
The reaction at a particular area might reveal even more information than the fact of its presence.
4. Trends and Trend Direction
A trend is simply an ongoing movement in one direction.
Uptrends, downtrends, and ranging markets need to be interpreted differently. An uptrend can attract traders searching for continuation patterns by analyzing pullbacks, while a ranging market will call for more emphasis on the range levels.
The use of trend analysis is enhanced when traders avoid assuming that each counter-trend move is always a reversal pattern.
But rather, consider these questions:
- Have any changes been made to the existing pattern?
- Do the swing points that matter remain intact?
- Has momentum been eroded?
- Has the price created a new sequence of direction?
These questions help separate temporary fluctuations from meaningful changes.
5. Pullbacks and Retracements
It is rare for markets to travel in one direction all at once. In cases where there is a clear trend, even very strong trends might experience retracements.
Retracements are instances where the price travels against the trend before reverting back.
For instance, in an established bullish trend, price might travel downward to a previous swing level. The critical factor to determine is what comes after.
Traders may analyze:
- The location at which the pullback originates
- The extent to which price retraces
- If any major structure holds
- How price acts when it hits its former level
This makes pullbacks a contextual concept rather than a standalone entry signal.
6. Candlestick Behavior
Candles illustrate how the price moved in a certain time period with its open, high, low, and close prices.
The form of the candle can give us an idea about the buying and selling pressure. Long upper shadow, for example, suggests rejection of higher prices, but if the close price was strong and close to the high price, then we may conclude that the sellers dominated most of the time period.
But the candle cannot be understood separately.
Its position, previous movement, and price movement after this candle also affect the interpretation of the candle. That’s why the traders analyzing price patterns prefer to study the relationship between the candles rather than the patterns themselves.
7. Breakouts
Breakout is the price movement out of an existing boundary like resistance, support, and ranges.
Breakout may indicate that there is a change in the balance between supply and demand. But moving outside the existing boundary does not always lead to continuity.
Traders could observe the following:
Whether price has closed above the boundary.
The strength of the breakout move.
Whether price stays outside the prior range.
What occurs in the next candles.
A breakout which quickly moves back into the prior range will give much different information from one that sees continued movement afterwards.
8. Failed Breakouts
A failure breakout is where the price breaks out from a significant barrier but cannot sustain the breakout.
For instance, the price might move up past the level of resistance but falls back down past the barrier very soon. This could be an indication that the breakout was not supported by any adequate buying activity.
The importance of failures is the fact that they tell you what the market tried to achieve and the response from market participants.
In analyzing a failure, a trader should look at:
| Observation | Possible interpretation |
|---|---|
| Price breaks and holds | Greater evidence of continuation |
| Price breaks and quickly returns | Possible failed breakout |
| Price repeatedly tests a level | Increasing importance of that area |
| Breakout followed by strong reversal | Directional rejection |
The key is to evaluate the entire sequence rather than reacting to the initial break.
9. Rejection and Momentum
Price rejection happens when the price trend moves towards some level and cannot hold its direction.
When there is a sharp up move followed by a big down move, it can be considered as a rejection of higher prices. Alternatively, when there is a sharp down move followed by a huge up move, it can mean rejection of lower prices.
The strength of the price move is also an indicator in momentum. The possible indicators for changes in momentum can be:
- Small directional candles
- Deepening pull backs
- Inability to form new highs/lows
- Strong counter movements
A slow down doesn’t necessarily indicate an impending change in direction. It only means that the current move requires more scrutiny.
10. Reversals and Changes in Structure
A reversal is a significant change from the prevailing direction of movement.
The critical point is the difference between a temporary correction and a real structural shift.
For instance, there will be no end to the up-trend if prices make a sharp decline.
However, traders may search for a clear signal like a break of an important swing low and then form a different pattern of highs and lows.
One method of analyzing reversals is:
- Establish the prevailing trend.
- Determine its key points on the chart.
- Note how prices respond at such points under pressure.
- Seek a consistent shift, not a single candlestick formation.
- Wait for the new structure to emerge.
This helps avoid mistakenly calling any retracement a reversal.
How These 10 Price Action Concepts Work Together
These ideas are most applicable when thought of as different parts of the same chart.
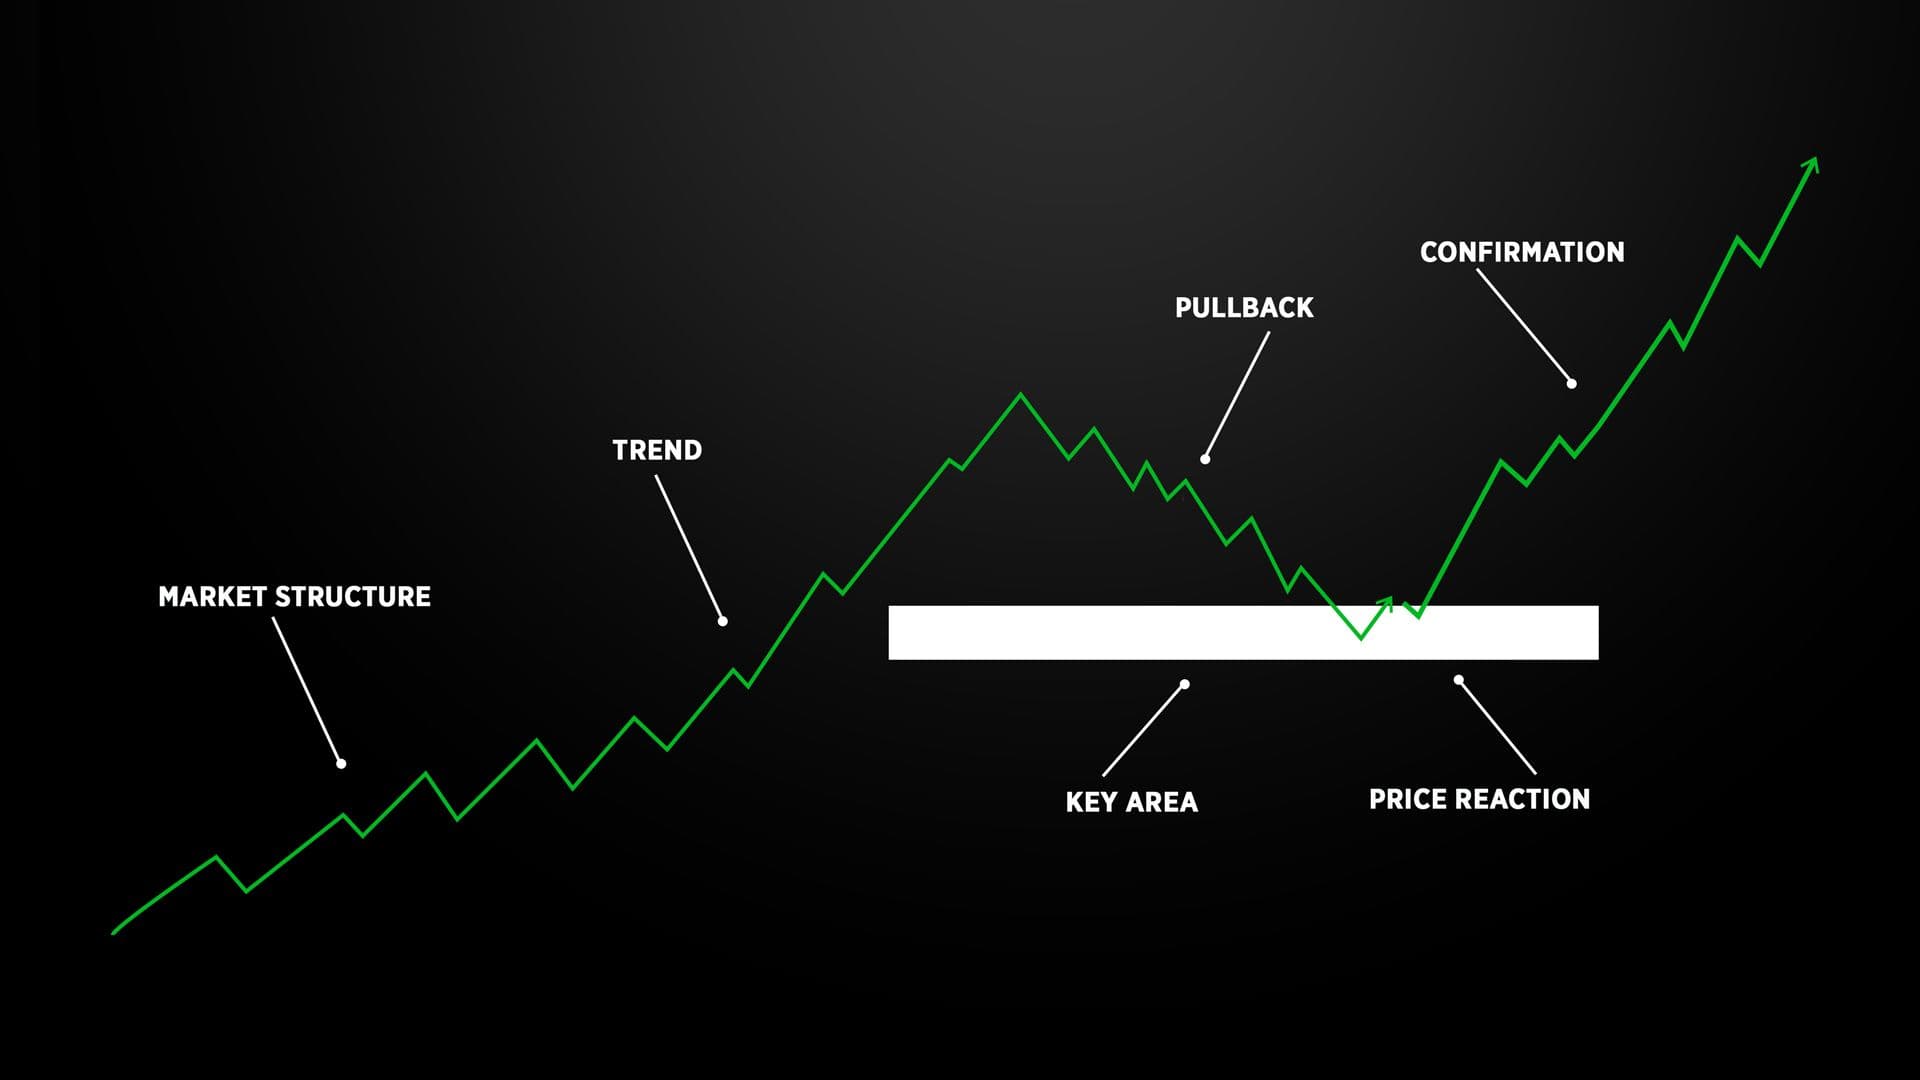
For instance, a trader can spot an uptrend based on market structure, see a retracement to support level, reject that area, and then wait for price to continue moving in the set direction.
It would look something like:
Market structure → Trend → Pullback → Key area → Price reaction → Confirmation
This is more useful than treating any single candle or level as a guaranteed signal.
A structured price action strategy can then define exactly what conditions must be present before entering, where the trade idea becomes invalid, and how the position will be managed.
A Simple Framework for Applying Price Action Concepts
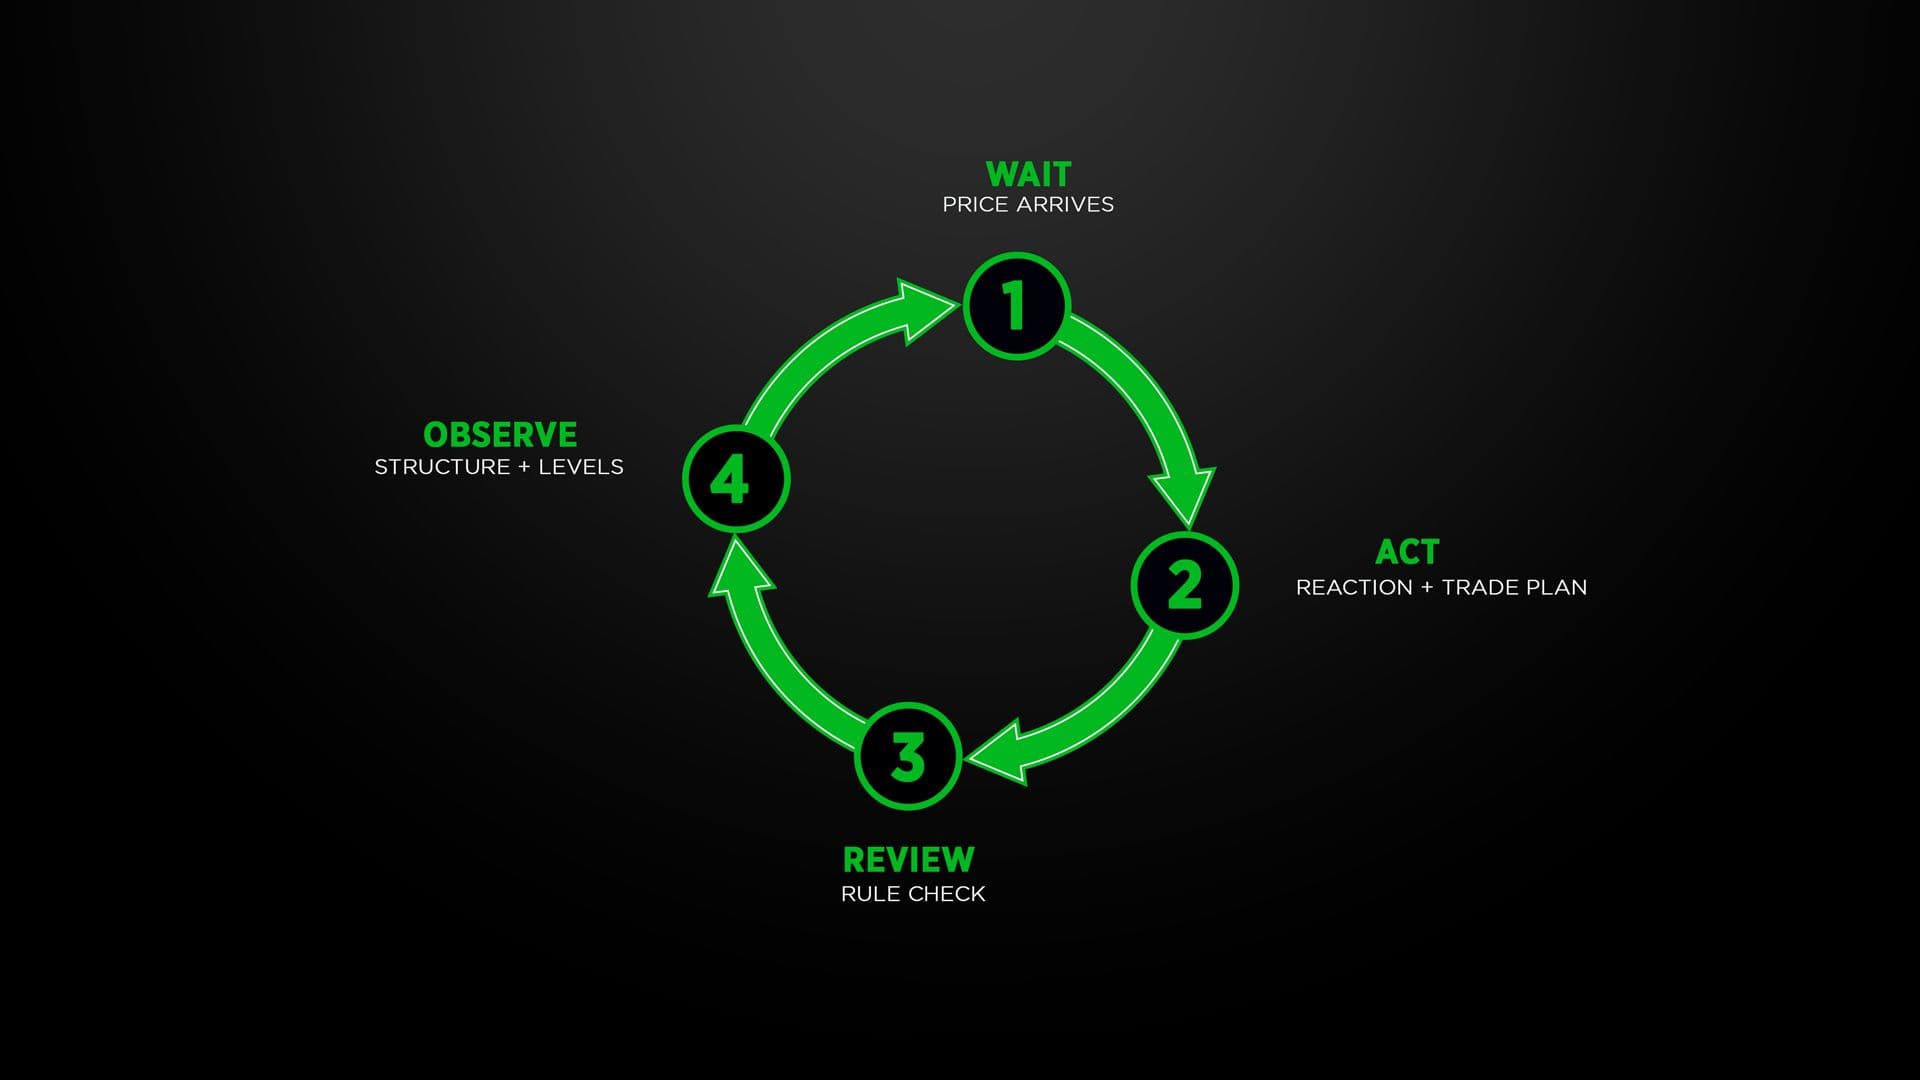
The difference between knowing the principles and using them effectively lies in the following workflow:
- Identify the structure: Recognize the overall state of the market.
- Mark significant spots: Recognize the important swing points and reaction zones.
- Wait for price action: Allow the market to get to a spot that is important for your strategy.
- Analyze price reaction: Detect whether it shows continuation, rejection, consolidation, or structure change.
- Set up your trade: Define the entry point, the place to invalidate it, and the point of exiting.
- Evaluate the outcome: Evaluate if your trade was performed according to the rules, no matter if it brought a profit or loss.
This approach keeps the analysis centered on observable market behavior.
Common Mistakes When Using Price Action
Things can get complicated when traders attempt to analyze all types of price moves.
Here are some common mistakes:
- Interpreting each candlestick pattern as a trading signal
- Identifying too many support and resistance levels
- Failing to take into account the market context
- Believing that each breakout should proceed
- Classifying each retracement as a reversal
- Altering the initial interpretation based on the result
- Taking a trade before the required conditions arise
A chart with fewer signals but well-defined rules may be better than one with many signals.
Conclusion
Price action concepts are useful in helping understand what the market is telling us through its price action. The market structure tells us the bigger picture, swing levels mark important pivot points, support and resistance are reaction zones, and in addition, pull-backs, breakouts, rejection, momentum, and reversal offer us a further context.
The best application of price action concepts lies in using them in an established system instead of looking out for one perfect signal. One can gain from learning price behavior at key events by observing the market action.
Frequently Asked Questions
What are the most important price action concepts?
The market structure, swing highs and lows, trends, support and resistance, pullback, candlestick patterns, breakout, false breakout, rejection, momentum, and structural reversal are some of the main topics which traders learn about.
Can beginners learn price action without indicators?
Absolutely. Beginners can learn all these topics directly through price action on charts. Starting with market structure, swing points, and trends is good before going to further technicals.
Are price action concepts enough to create a profitable trading strategy?
They form a basis, but they are no guarantee of profitability. In addition to the ideas discussed, an entire trading methodology would also need to include rules, risk management, position sizing, and testing.